Three-Screen Canvas App
We can generate a canvas app by using a data source. We can use data from many other sources, including Microsoft Dataverse, Microsoft SharePoint, Excel workbook, cloud services like Salesforce, and on-premises sources like Microsoft SQL Server. This gives us the flexibility to build our app from our data no matter where it lives. We can also combine data sources within Power Apps to easily create associations between different data sources.
When we create an app from data, all aspects of the generated app including screens, layouts, and formulas can be modified.
Three- Screen Canvas App Follow the following steps to create a three-screen canvas app, generated directly from data:
Step 1: Suppose we have the following Data in our excel file, named Ashish table.
You can download the excel file from here, and use it in this exercise.

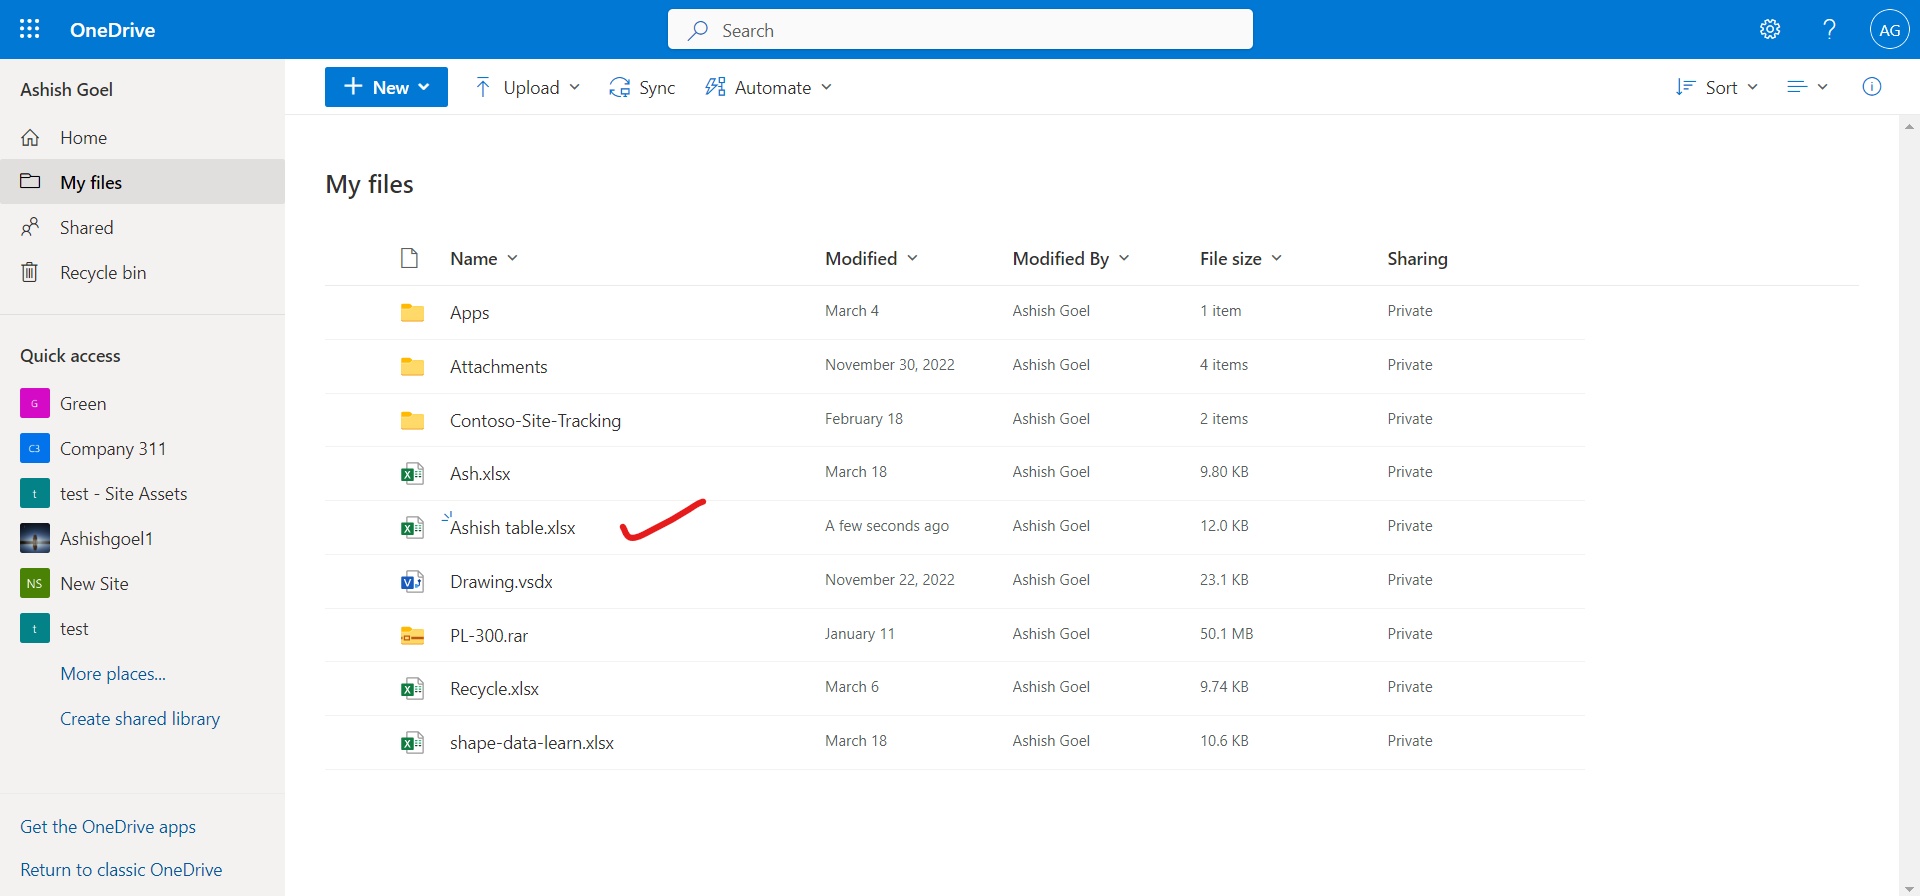
Step 2: We can upload our excel workbook to the OneDrive for Business.
Step 3: Go to Official Power Apps Link and sign in with your organizational account.
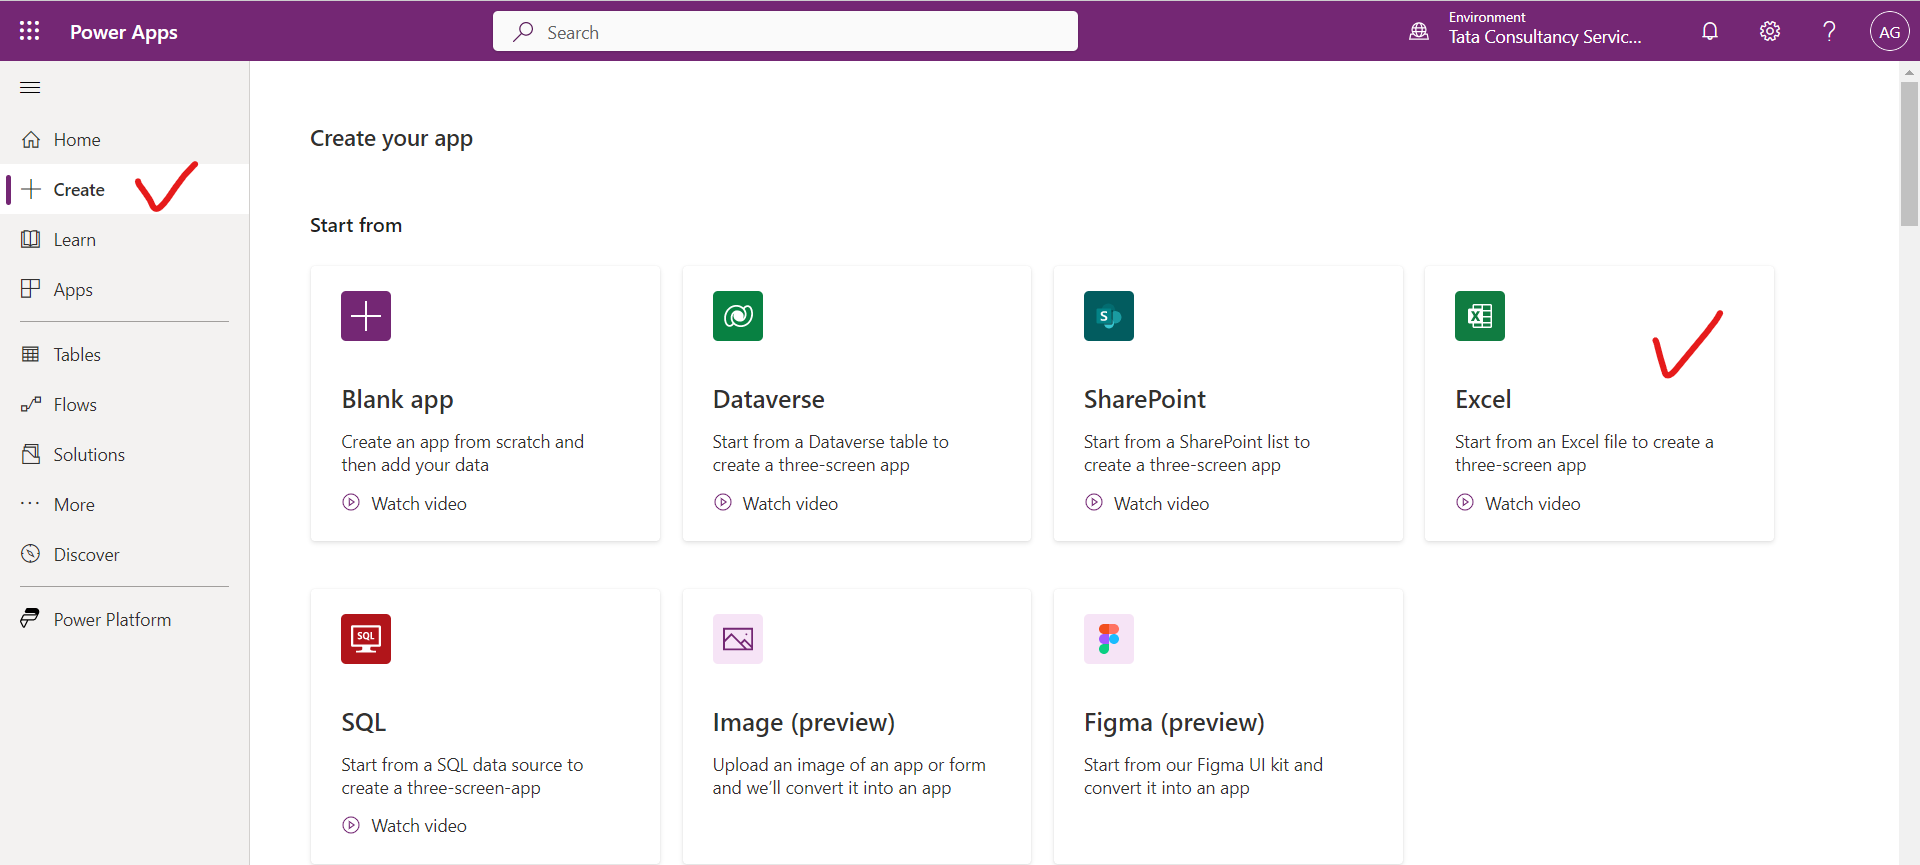
Step 4: In the left pane, select Create.
Step 5: Choose Excel from Start from section.
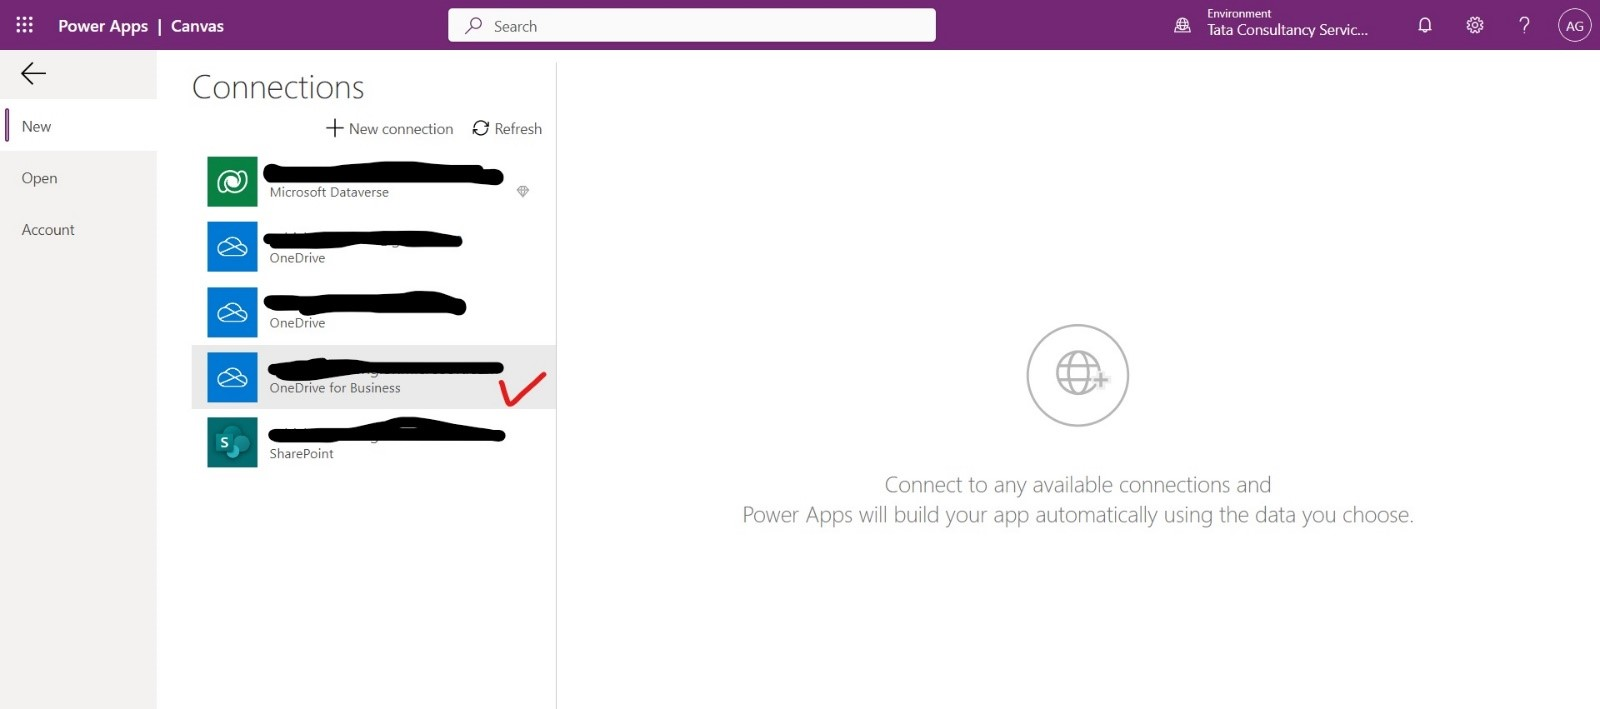
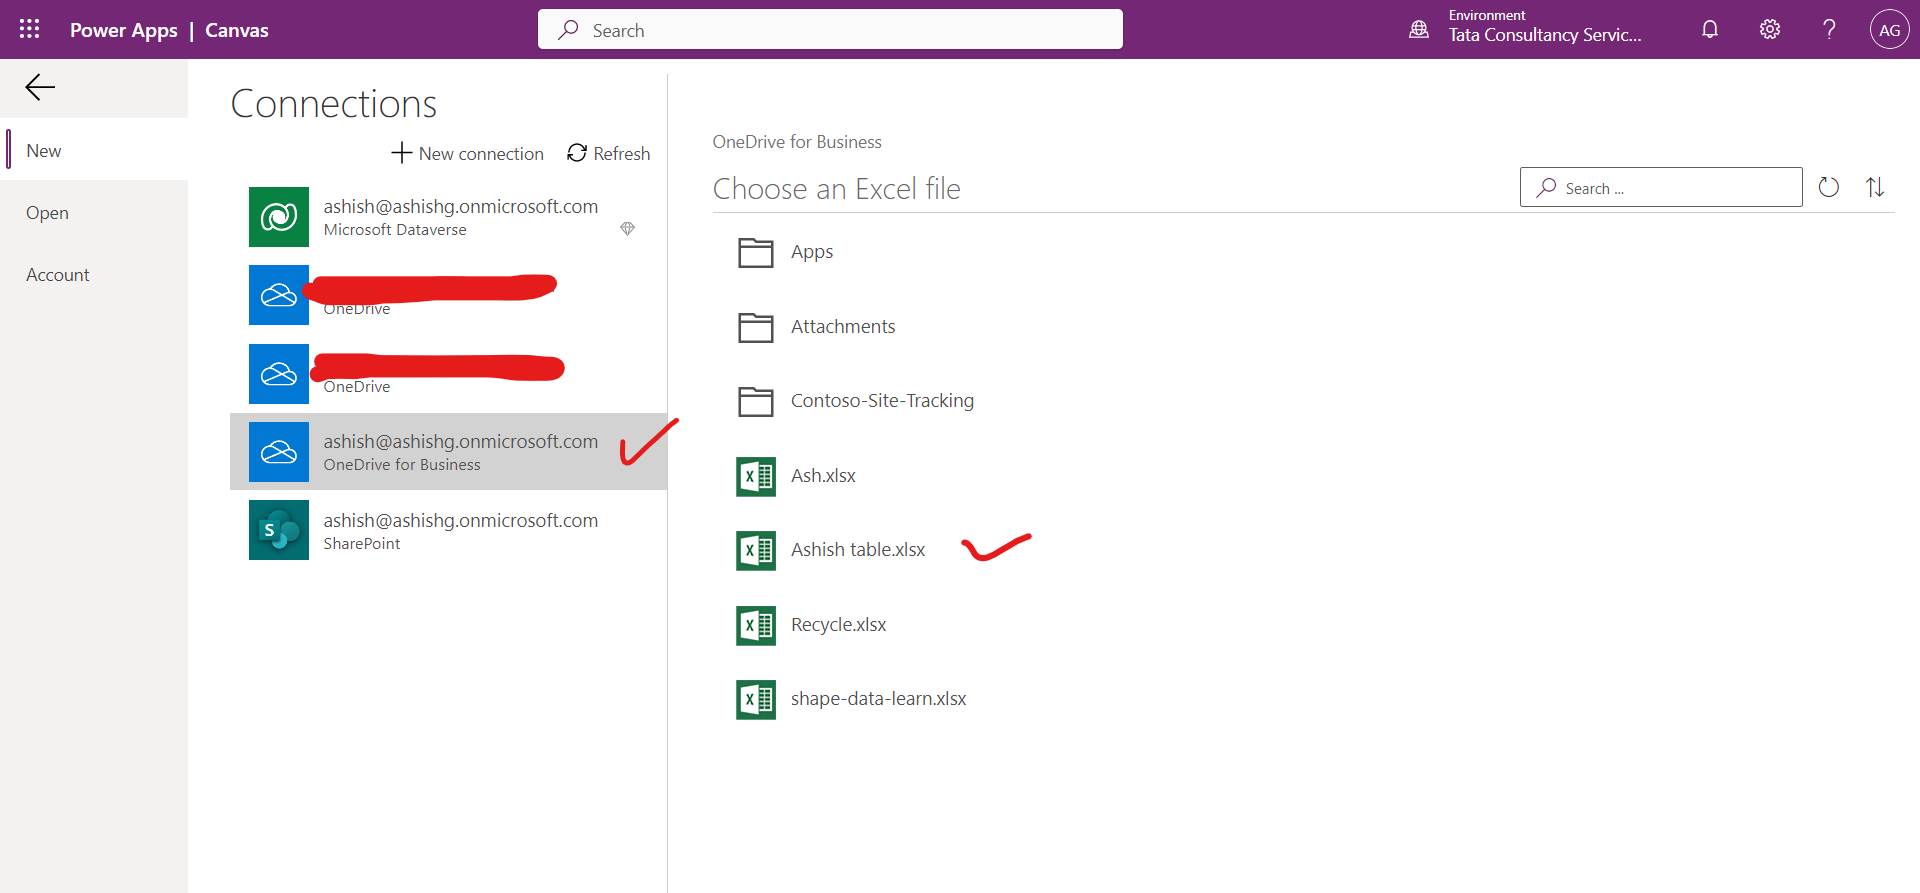
Step 6: Under Connections, choose OneDrive for Business. If you don't have the connection available, click New connection to create one.
Step 7: For Choose an Excel file on the right select the Ashish table.xlsx file and then select the table.
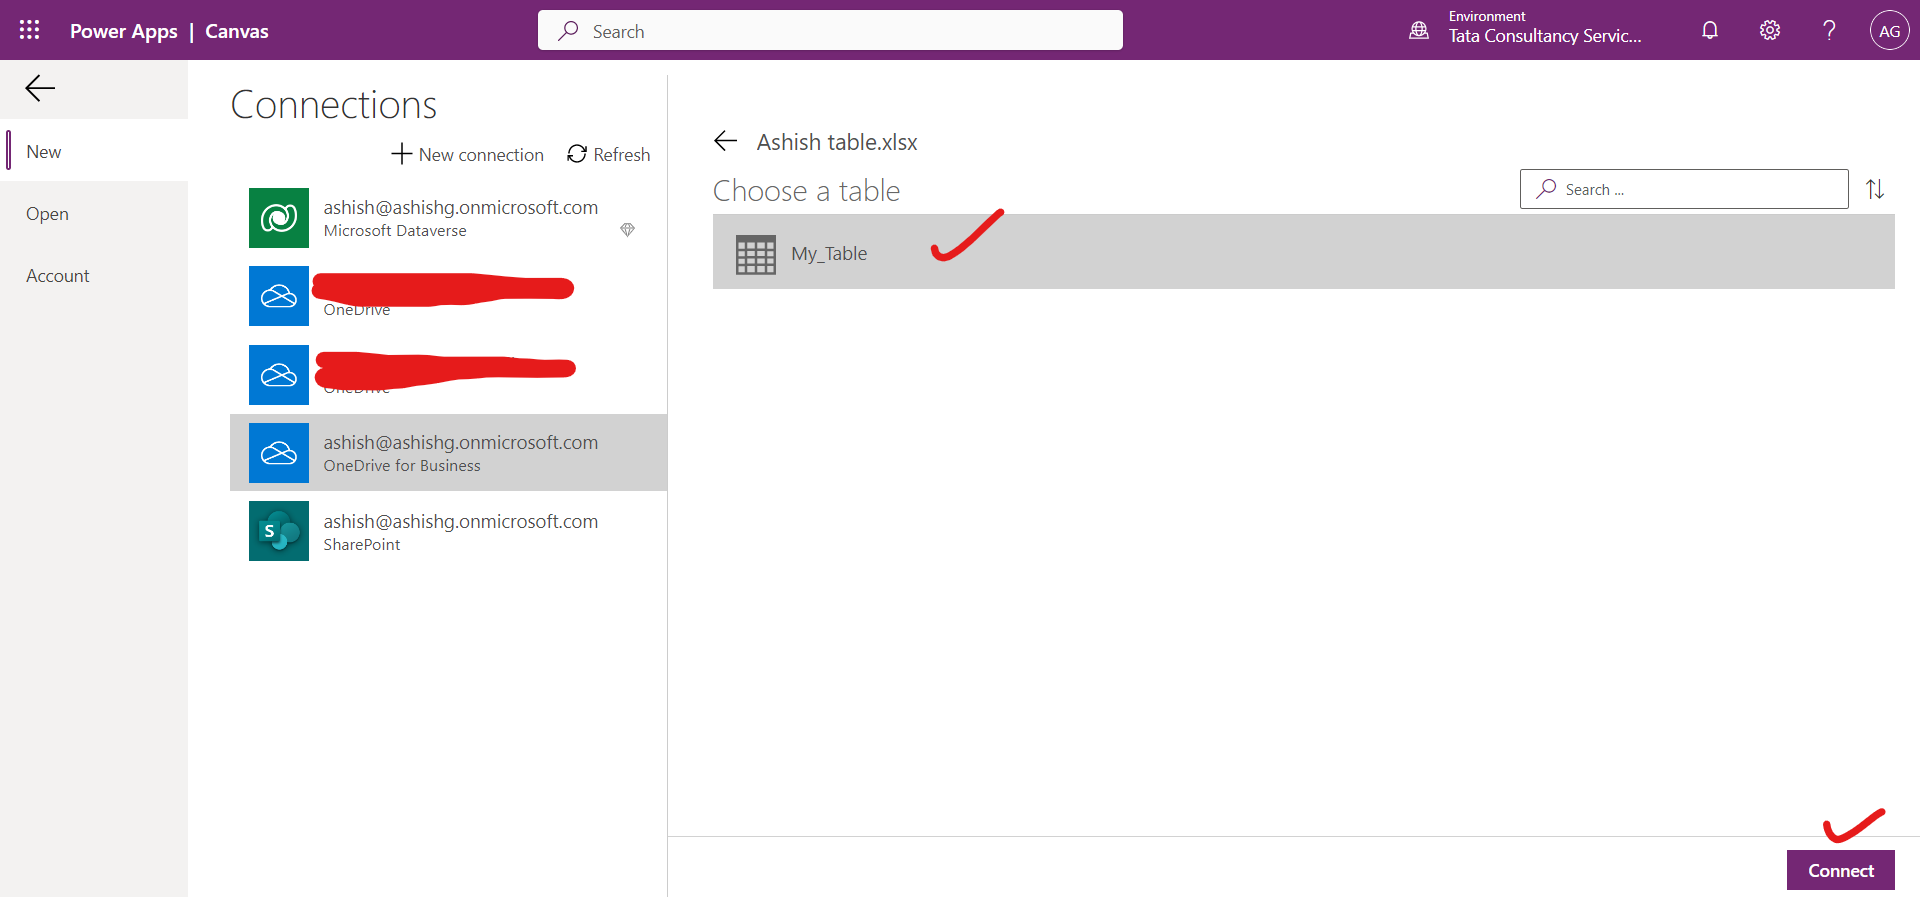
Step 8: For Choose a table click My_Table and click Connect.
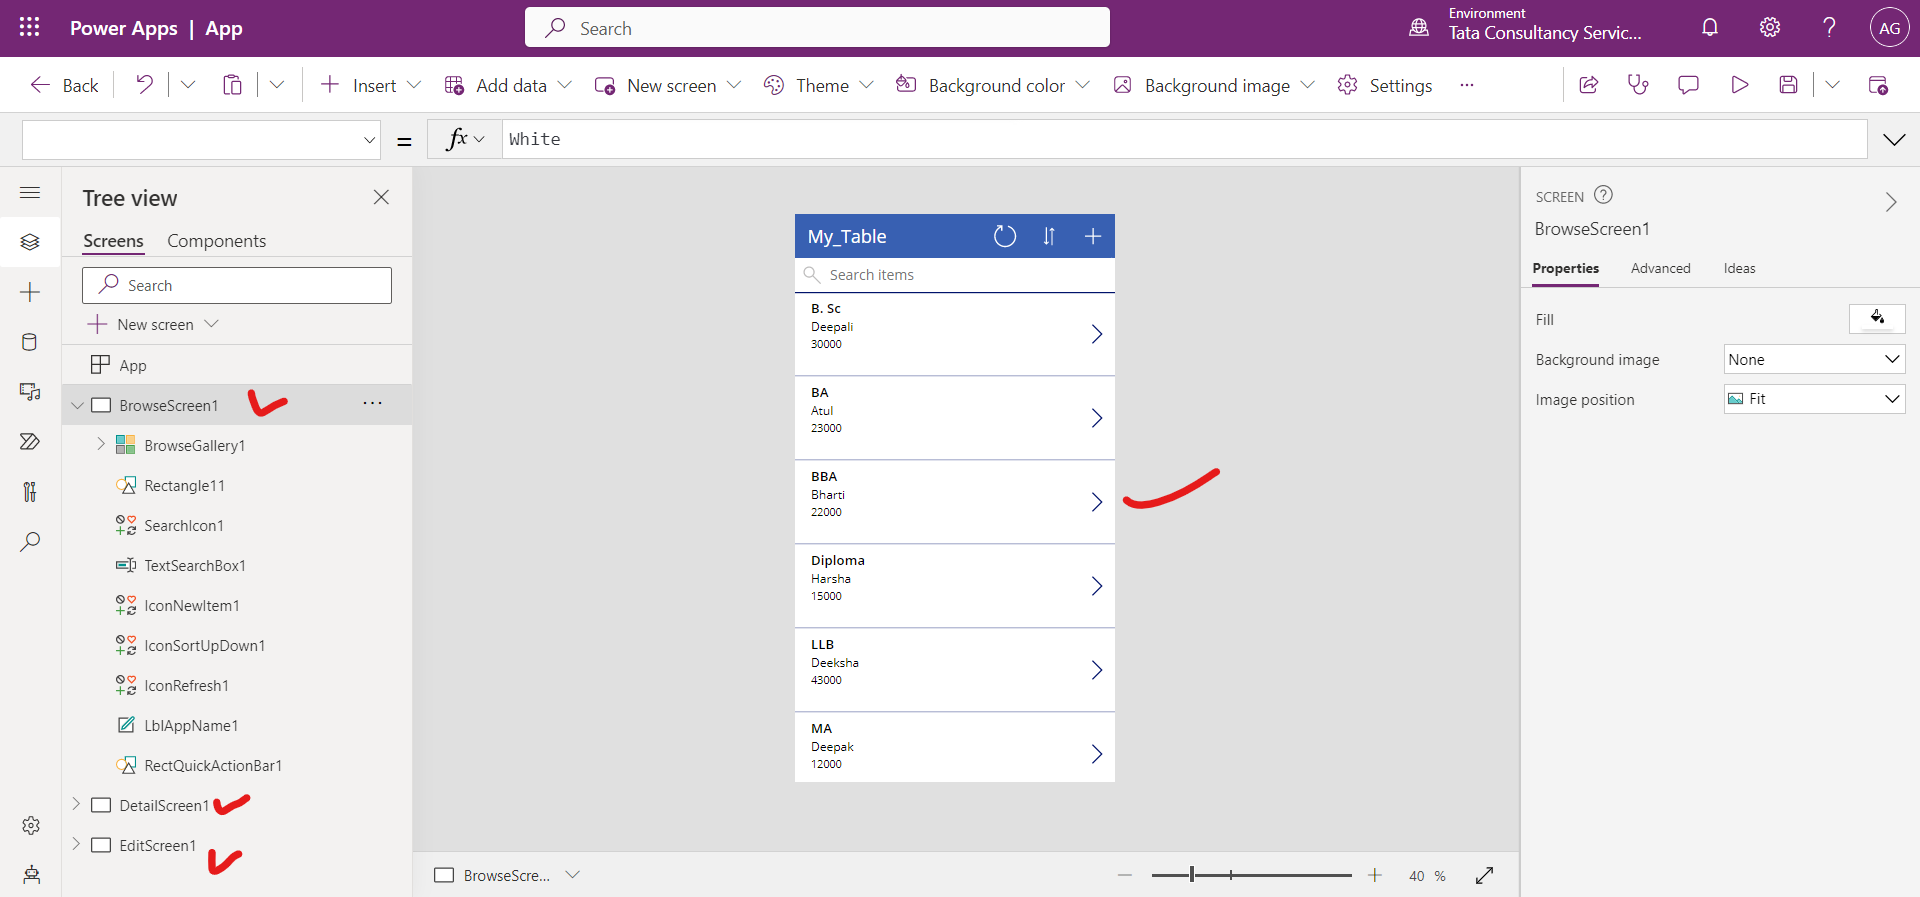
A three-screen app is created. Power Apps generates the app by inspecting the data and matching it with Power Apps capabilities so that we get a working app as a starting point. Generated apps are always based on a single list or table, but we can add more data to the app later.
Step 9:The app is ready and the following figure shows the main development window for Power Apps Studio.
Select Play icon in the upper-right corner to practice using the app or by selecting the F5. Notice that it includes all the data from the table and provides a good default experience.
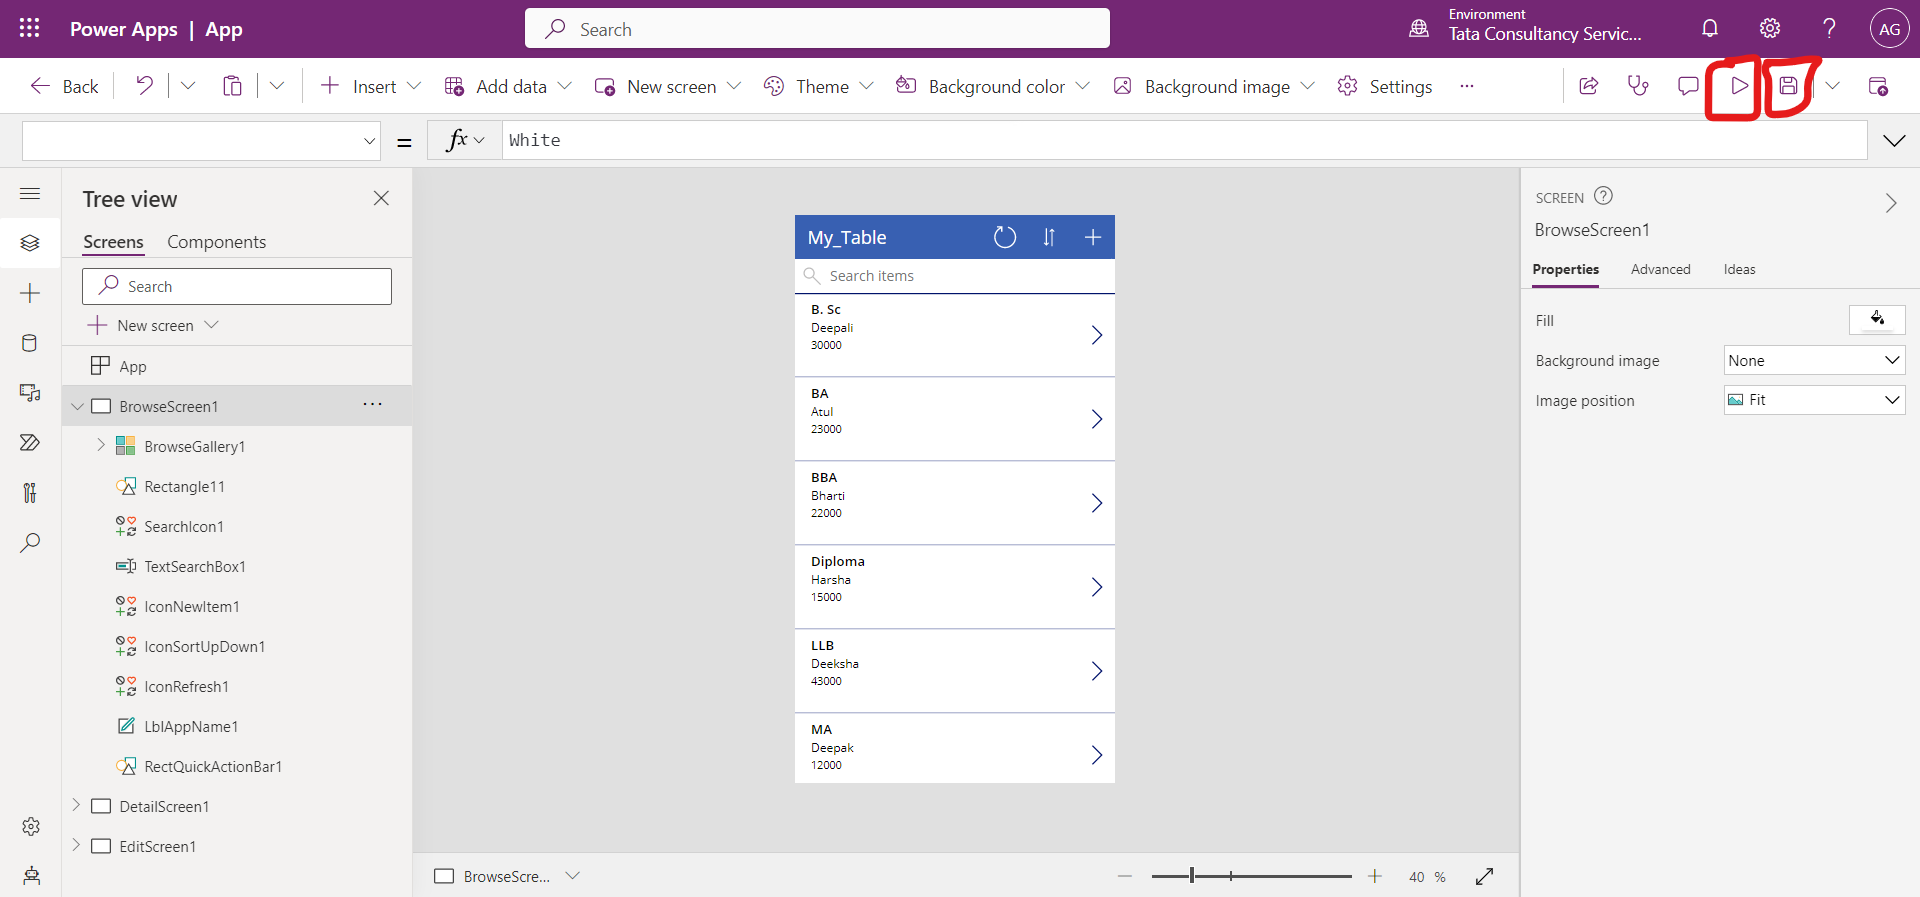
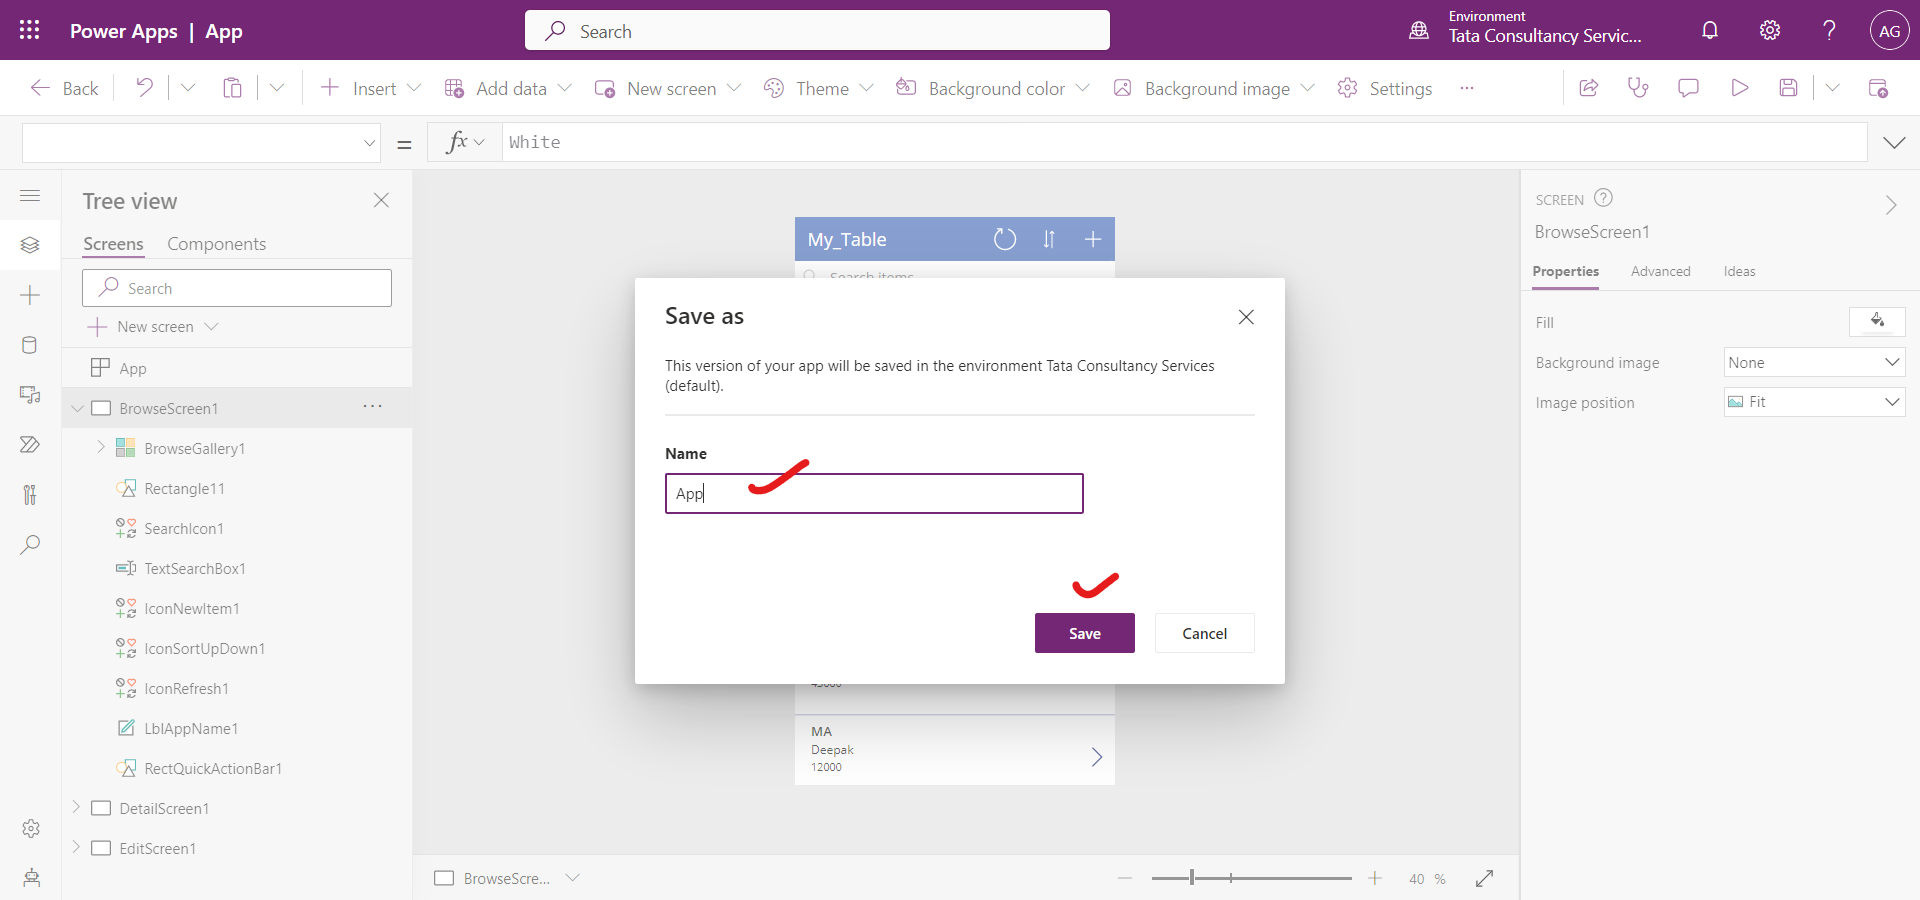
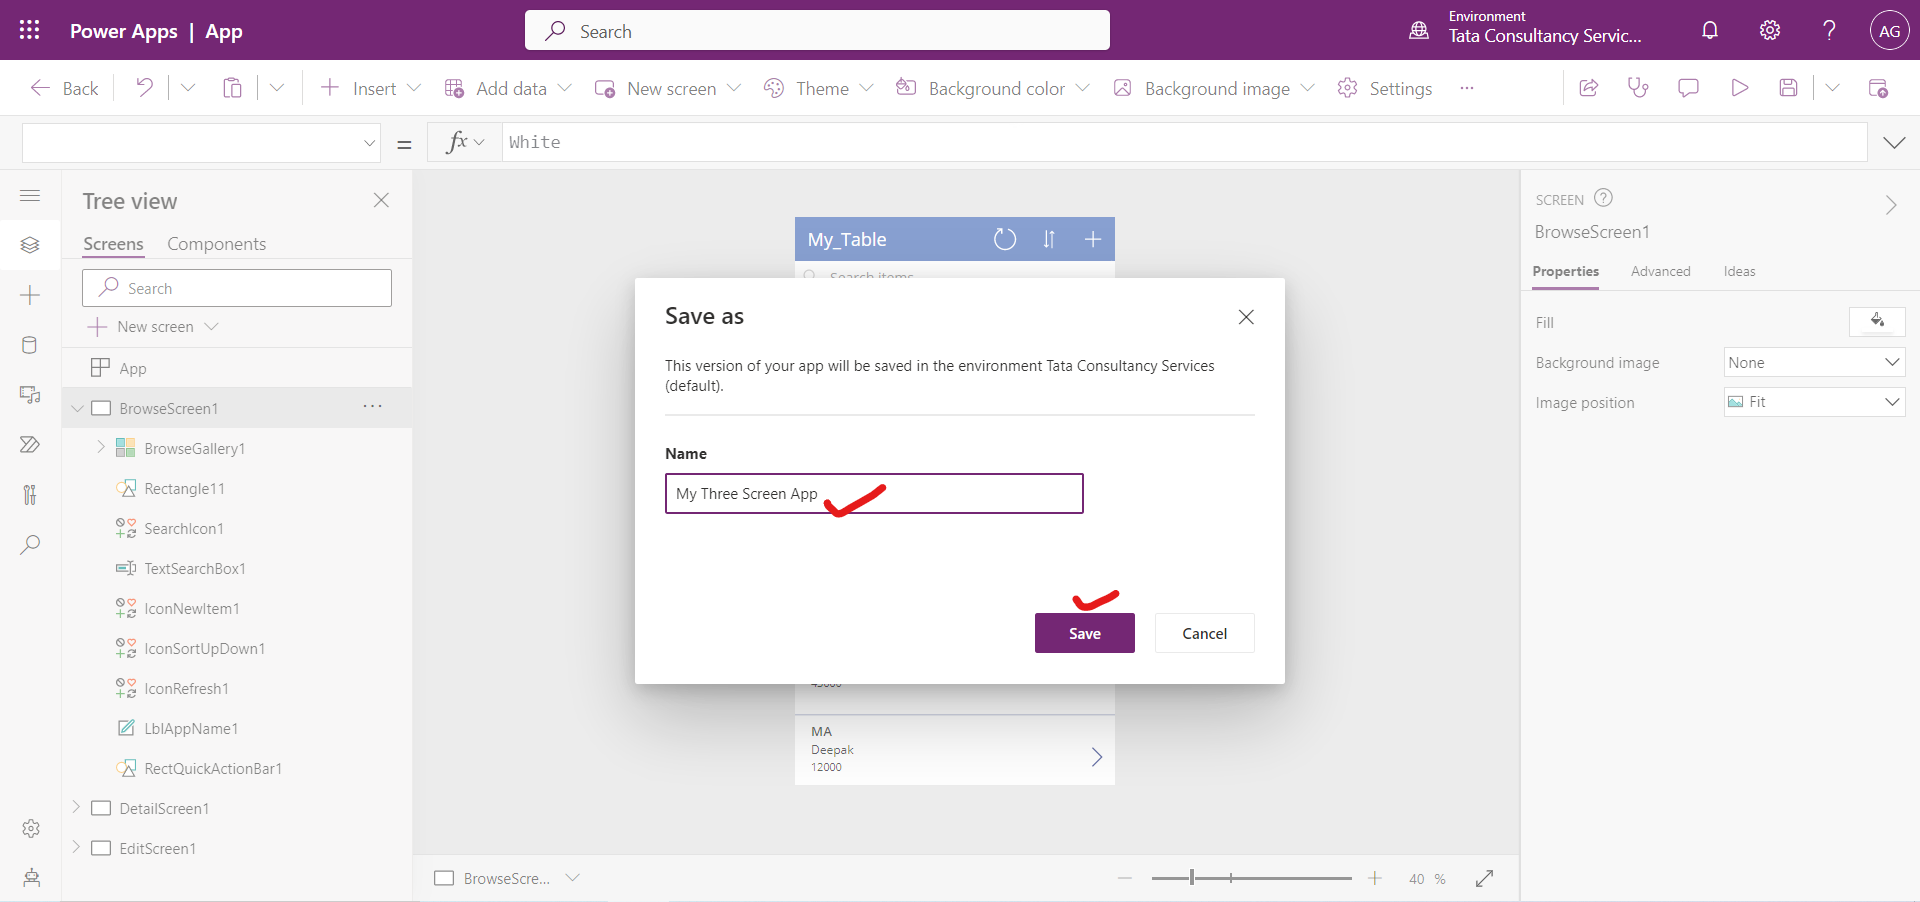
To close the preview mode, select the "X" in the upper-right corner. Click on the Save icon to save the app. Change the default name App to something else and click on Save.
Components of the Three-Screen Canvas App
All apps that are generated from data have the same set of screens that we can view from the Screens pane.
1. Browse screen The BrowseScreen is the first screen in the app that is generated. In it, we can browse, sort, search, and refresh the data from the data source. In the browse screen, we have an icon plus sign (+), by selecting it we navigate to the different screen to create a record in the datasource.
The browse screen has multiple controls which include:
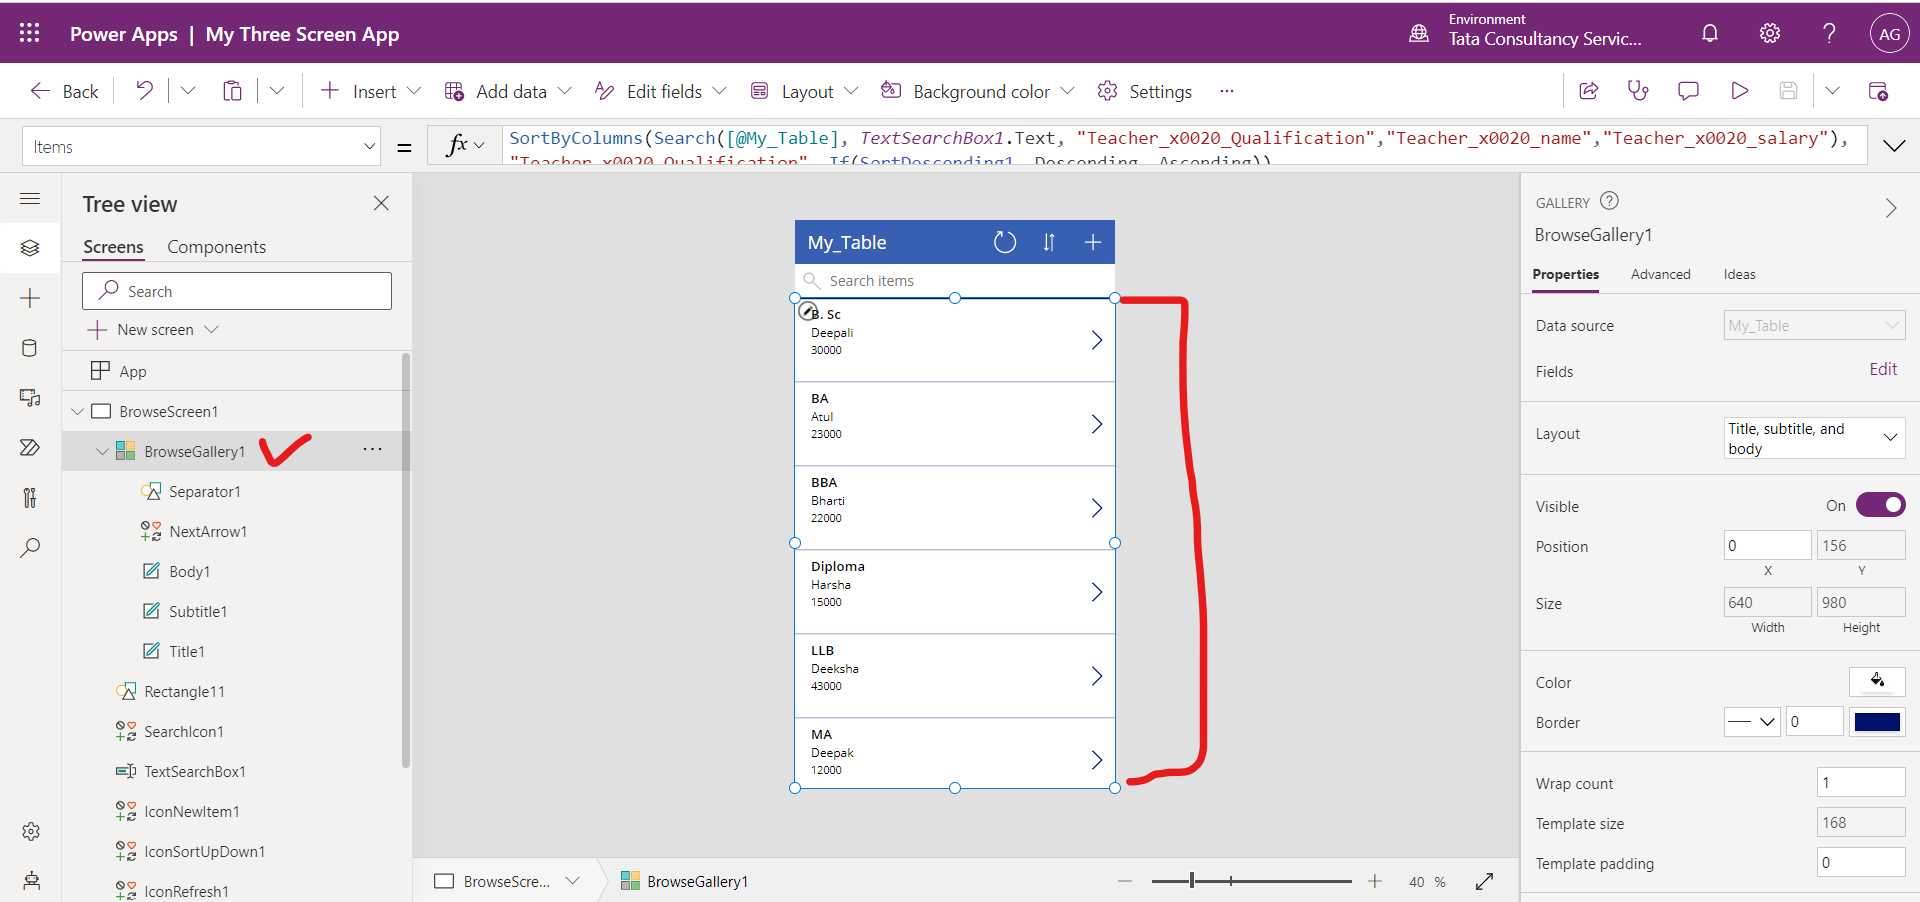
• BrowseGallery1 This Gallery control is used to show the data from the data source, from which the app is generated.
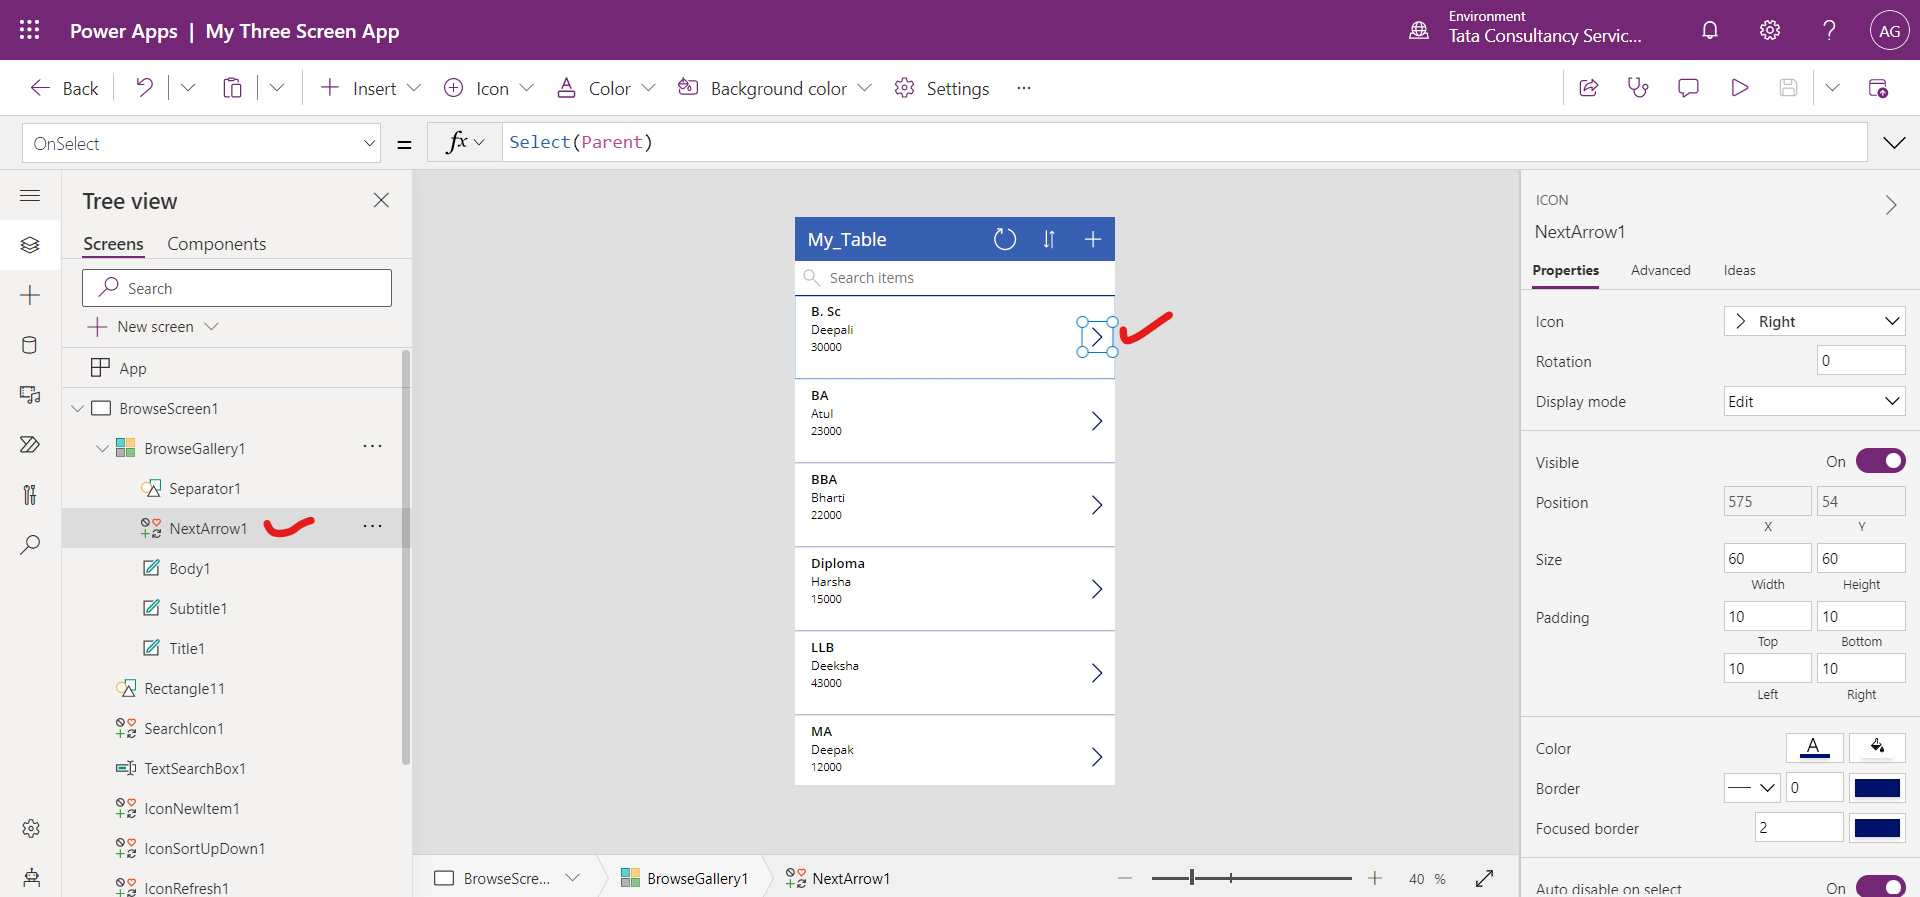
• NextArrow1 This is an icon control that is inside of BrowseGallery1 and that, when selected, opens the details screen to view the entire record.
• IconNewItem1 This is again an icon control that when selected, opens the edit/create screen to create a new item. The following power apps formula is written on this icon’s OnSelect property.
Power Apps Formula
The formula instantiates an edit page on the edit/create screen so that users can create an item. A value of ScreenTransition.None means that there is no transition, such as a fade, between screens at the time of navigation.
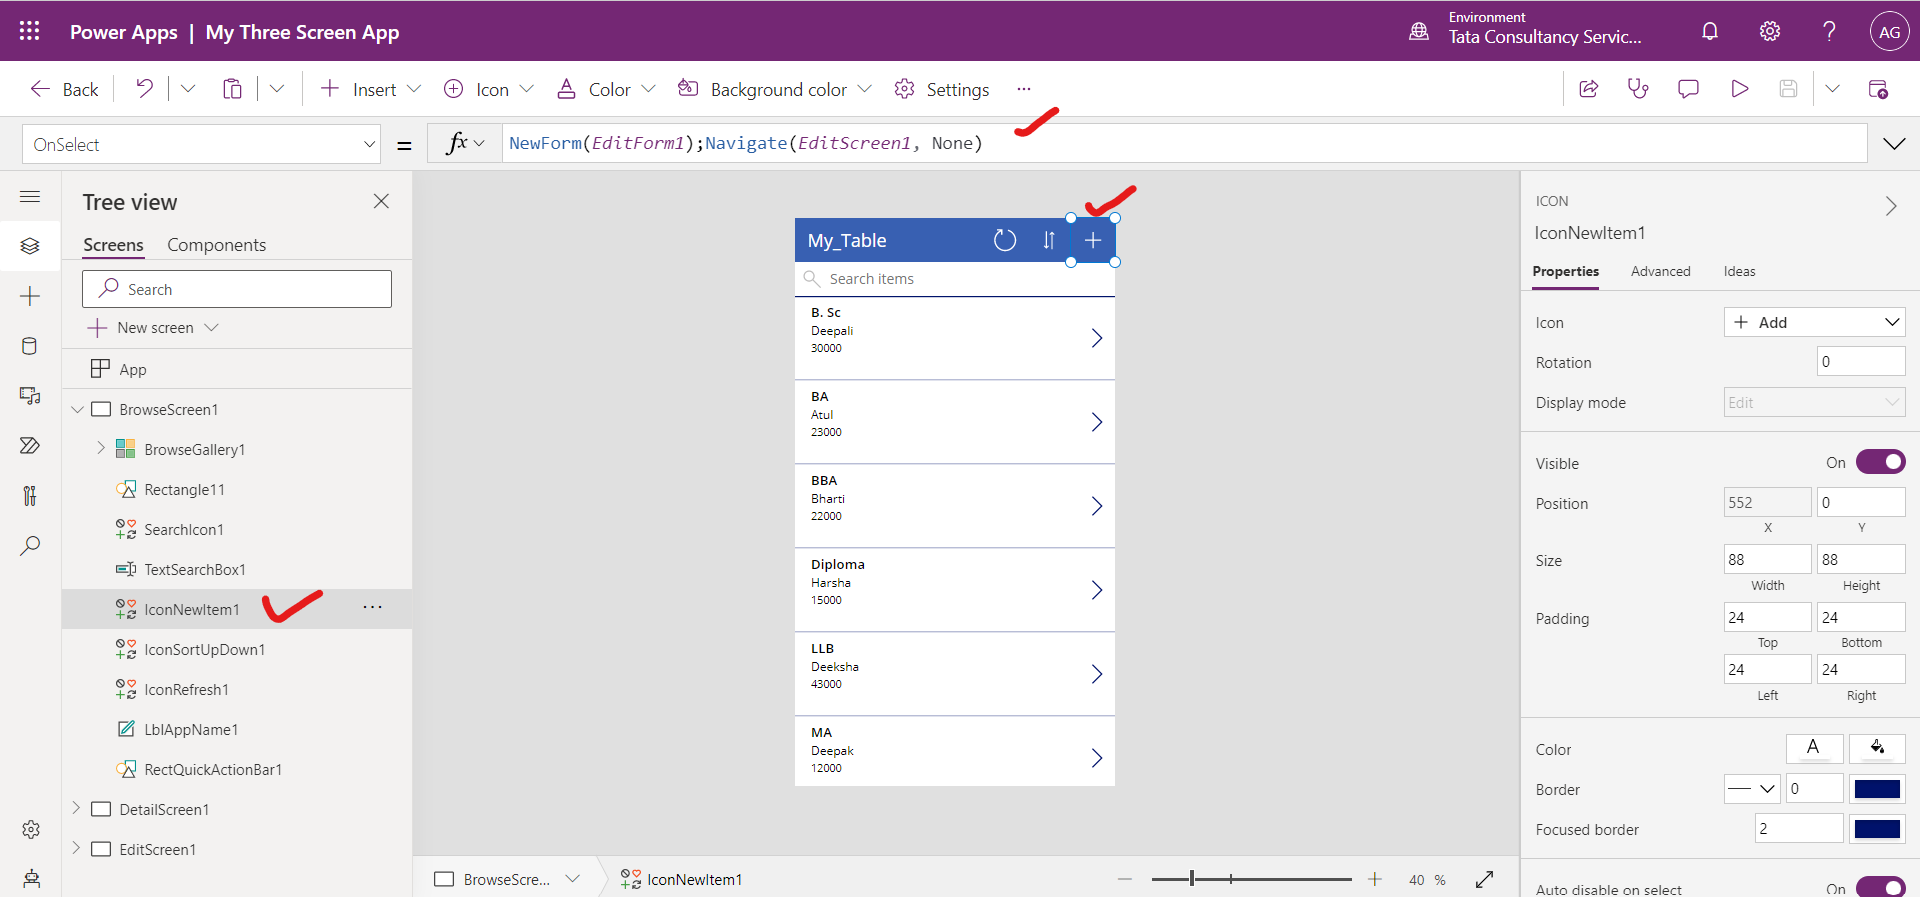
• IconSortUpDown1 This is an icon control which is used to sort the items in the gallery control. The following power apps formula is written on the icon’s OnSelect property of the control.
Power Apps Formula
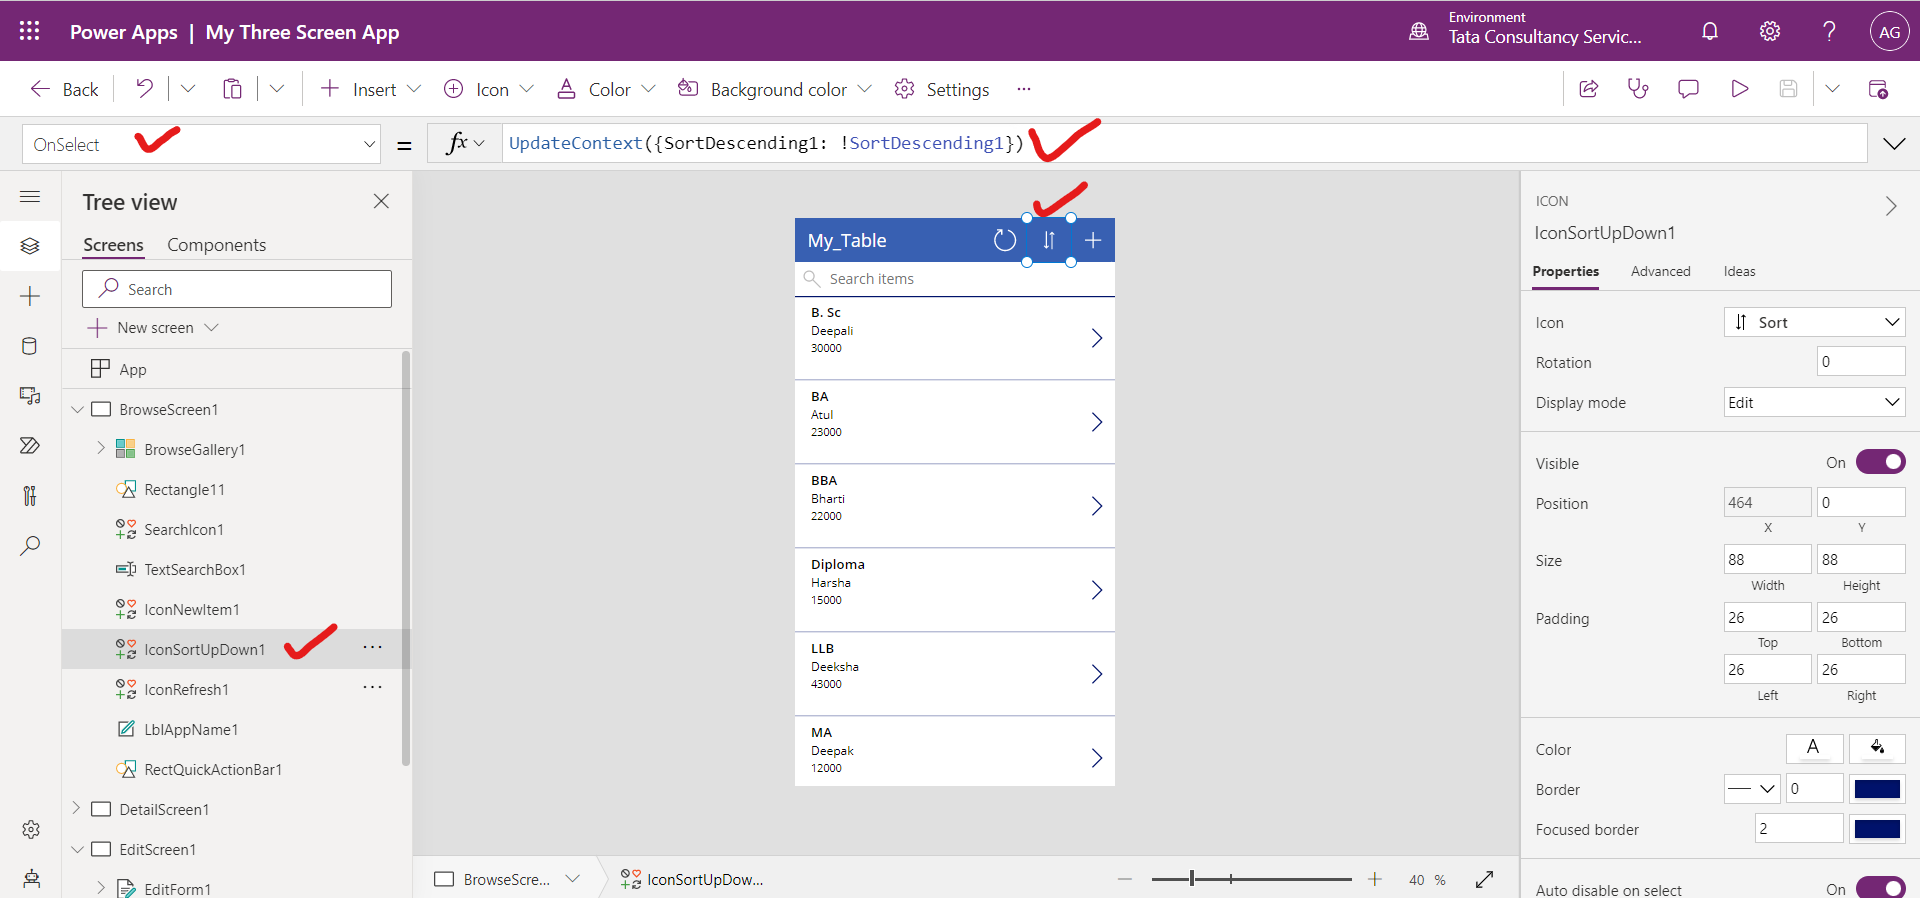
The formula uses UpdateContext function to update a context variable called SortDescending1. The exclamation "!" symbol in the formula is a shortcut for the Not function. The value of the variable switches back and forth as we select the control. This variable tells the gallery on this screen how to sort the items.
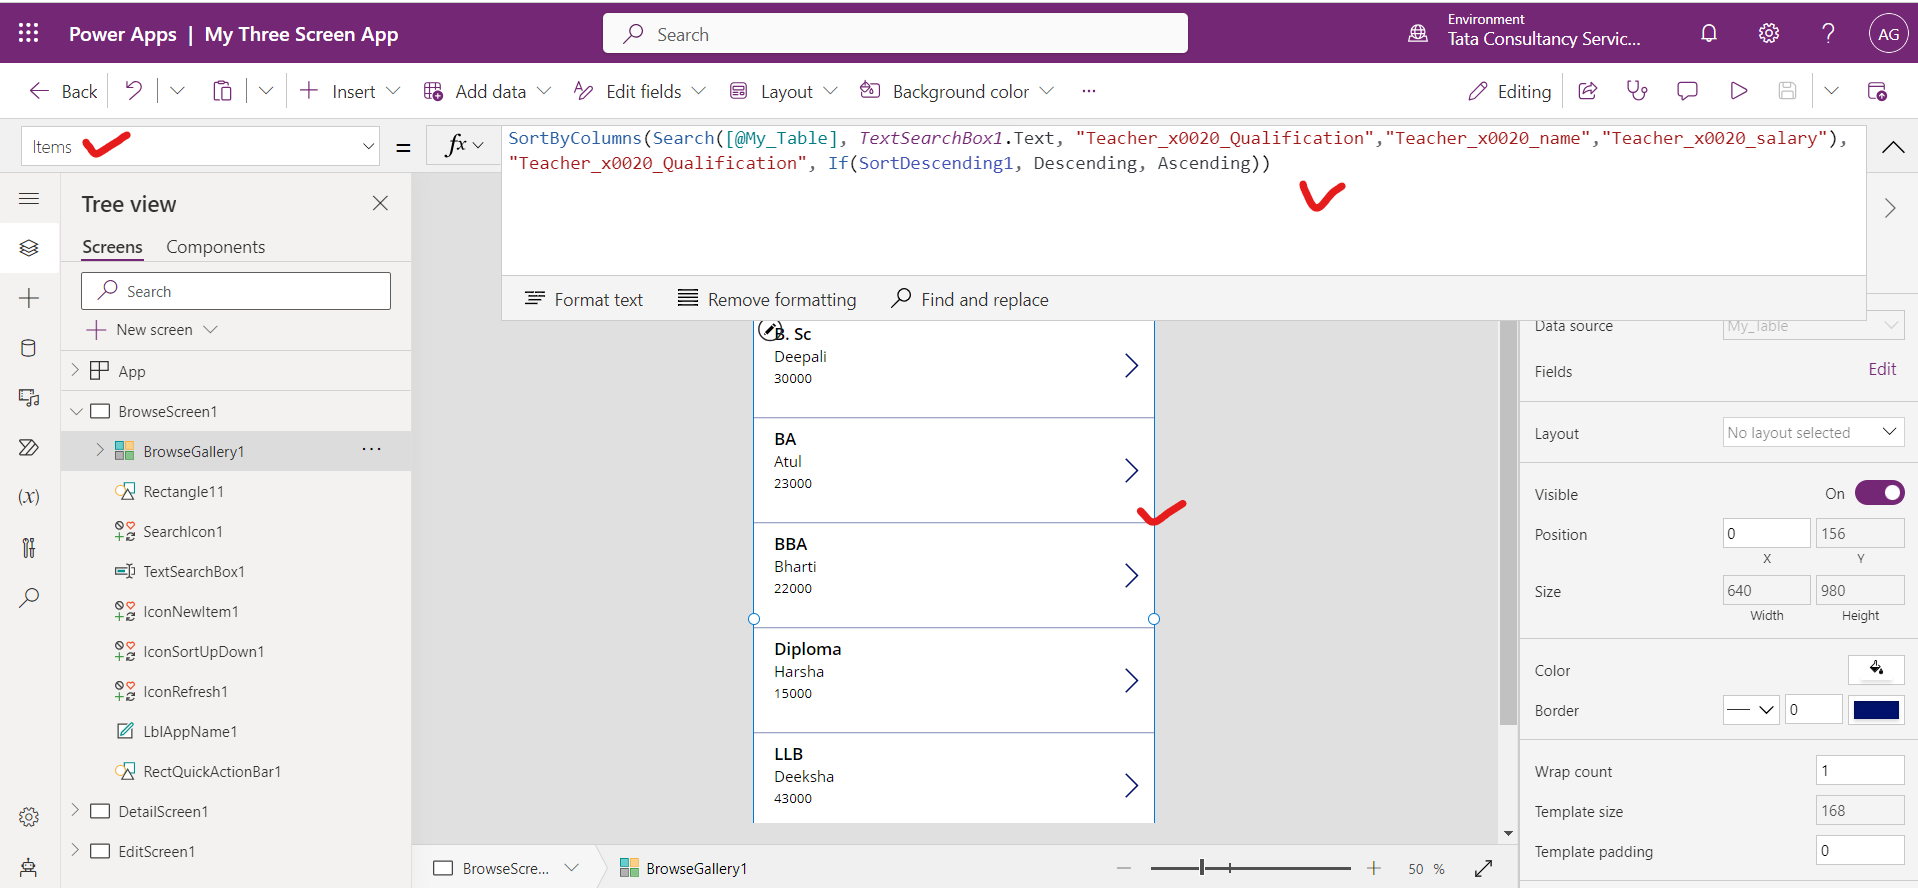
If we look at the gallery control’s Items property. The following power apps formula is written on the Item’s property of the gallery control.
Power Apps Formula
SortByColumns(
    Search(
        [@My_Table],
        TextSearchBox1.Text,
        "Teacher_x0020_Qualification",
        "Teacher_x0020_name",
        "Teacher_x0020_salary"
    ),
    "Teacher_x0020_Qualification",
    If(
        SortDescending1,
        SortOrder.Descending,
        SortOrder.Ascending
    )
) 
The app contains many other formulas, we can explore by selecting the control and determine what formulas are set for various properties.
2. Details screen The details screen is named DetailScreen1 by default. The details screen shows all information about a single item. In this screen, we can open an item to edit or delete it.
Some of its controls are as follows:
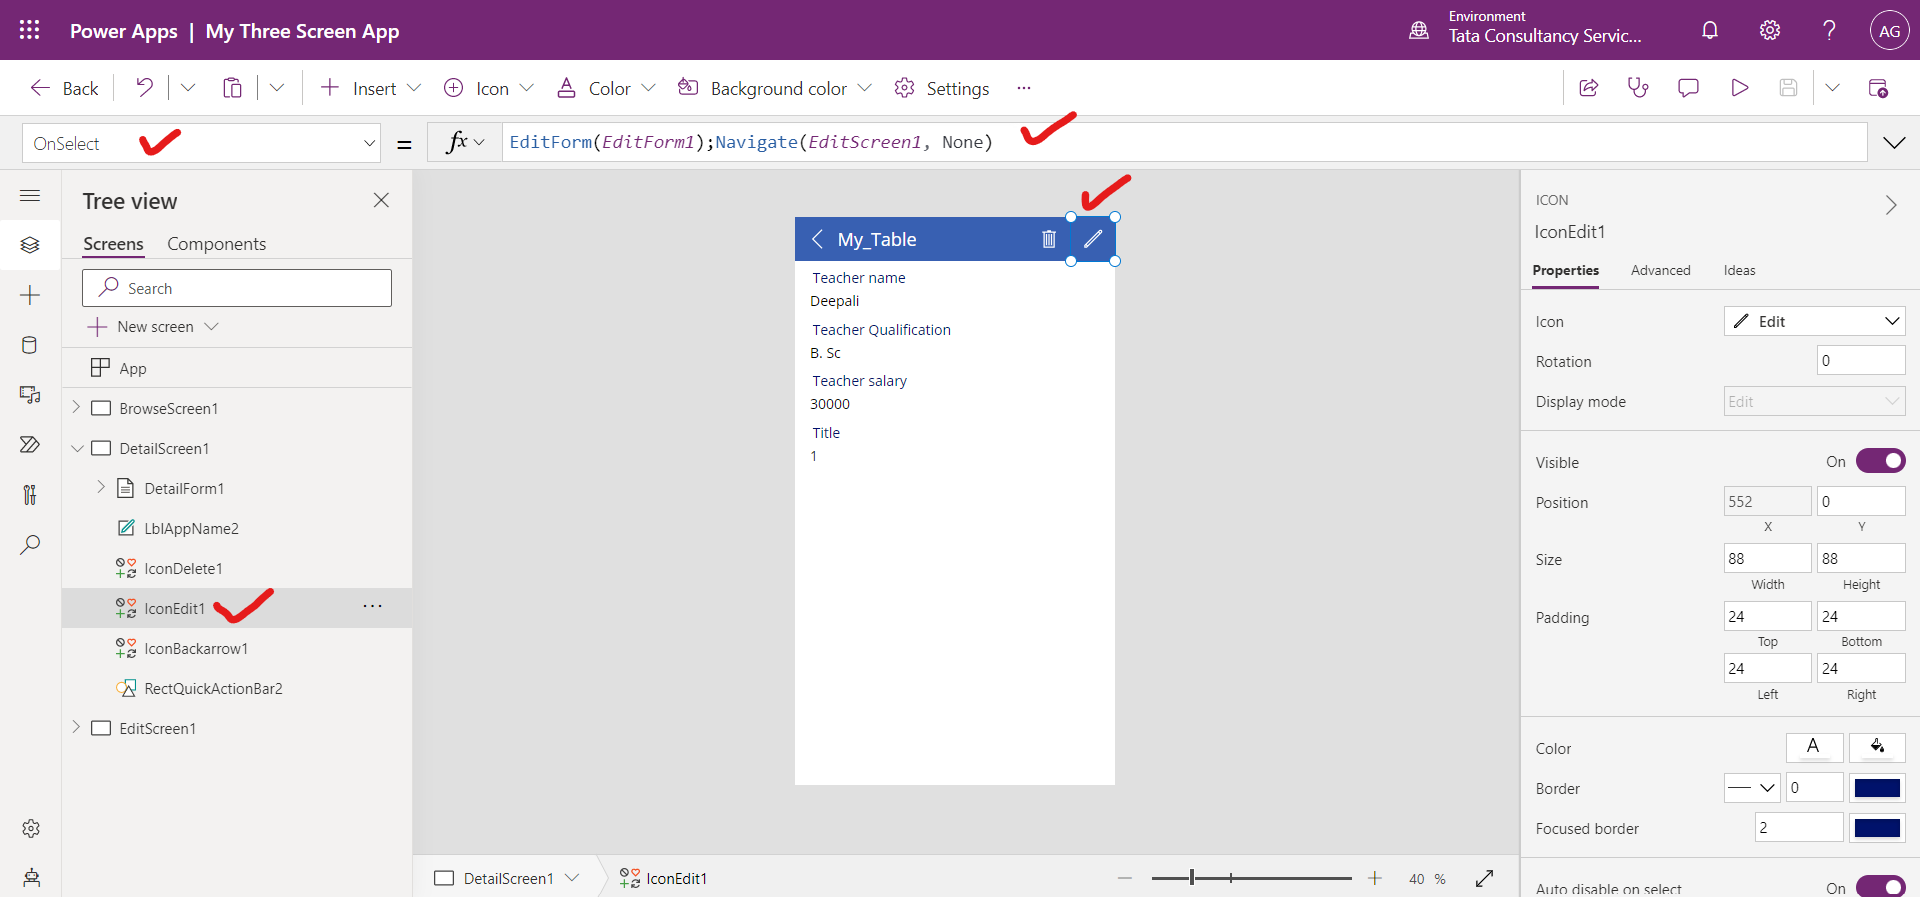
• IconEdit1 It is an icon control, when this control is selected, it opens the edit/create screen so that the user can edit the current item. The following power apps formula is written on the OnSelect property of the icon control.
Power Apps Formula
• DetailForm1 A Form control that contains other controls and contains a data card for each column of the row that is being displayed.
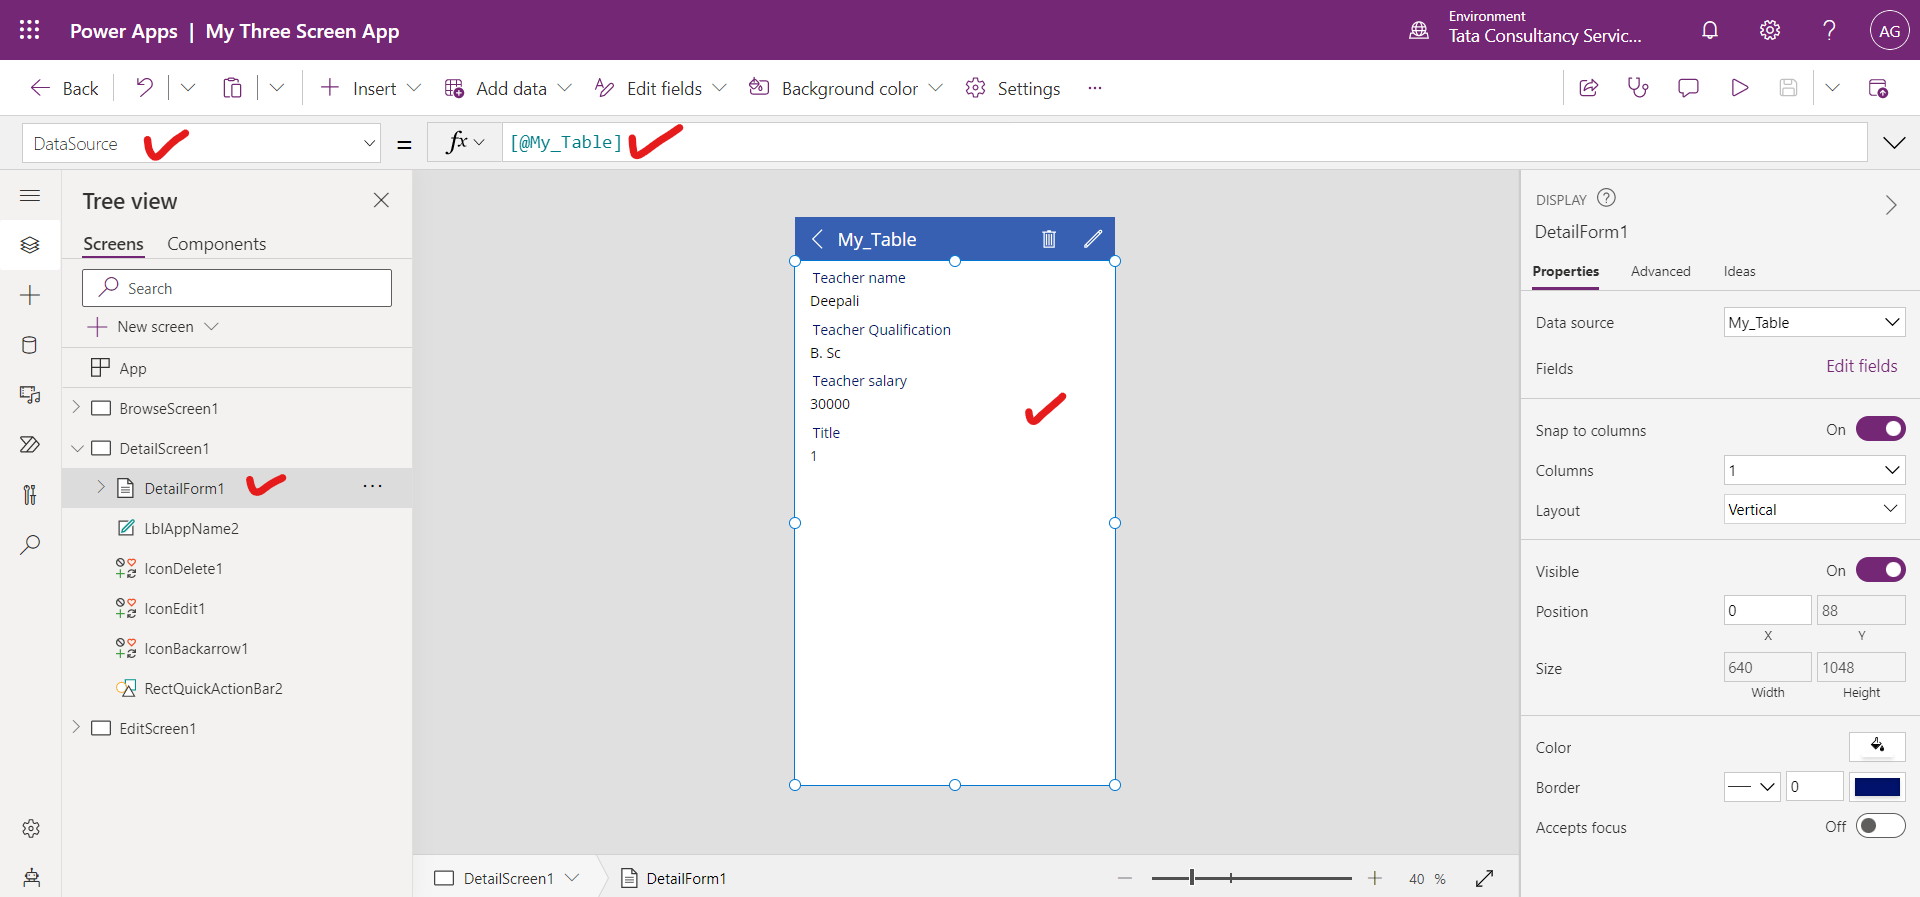
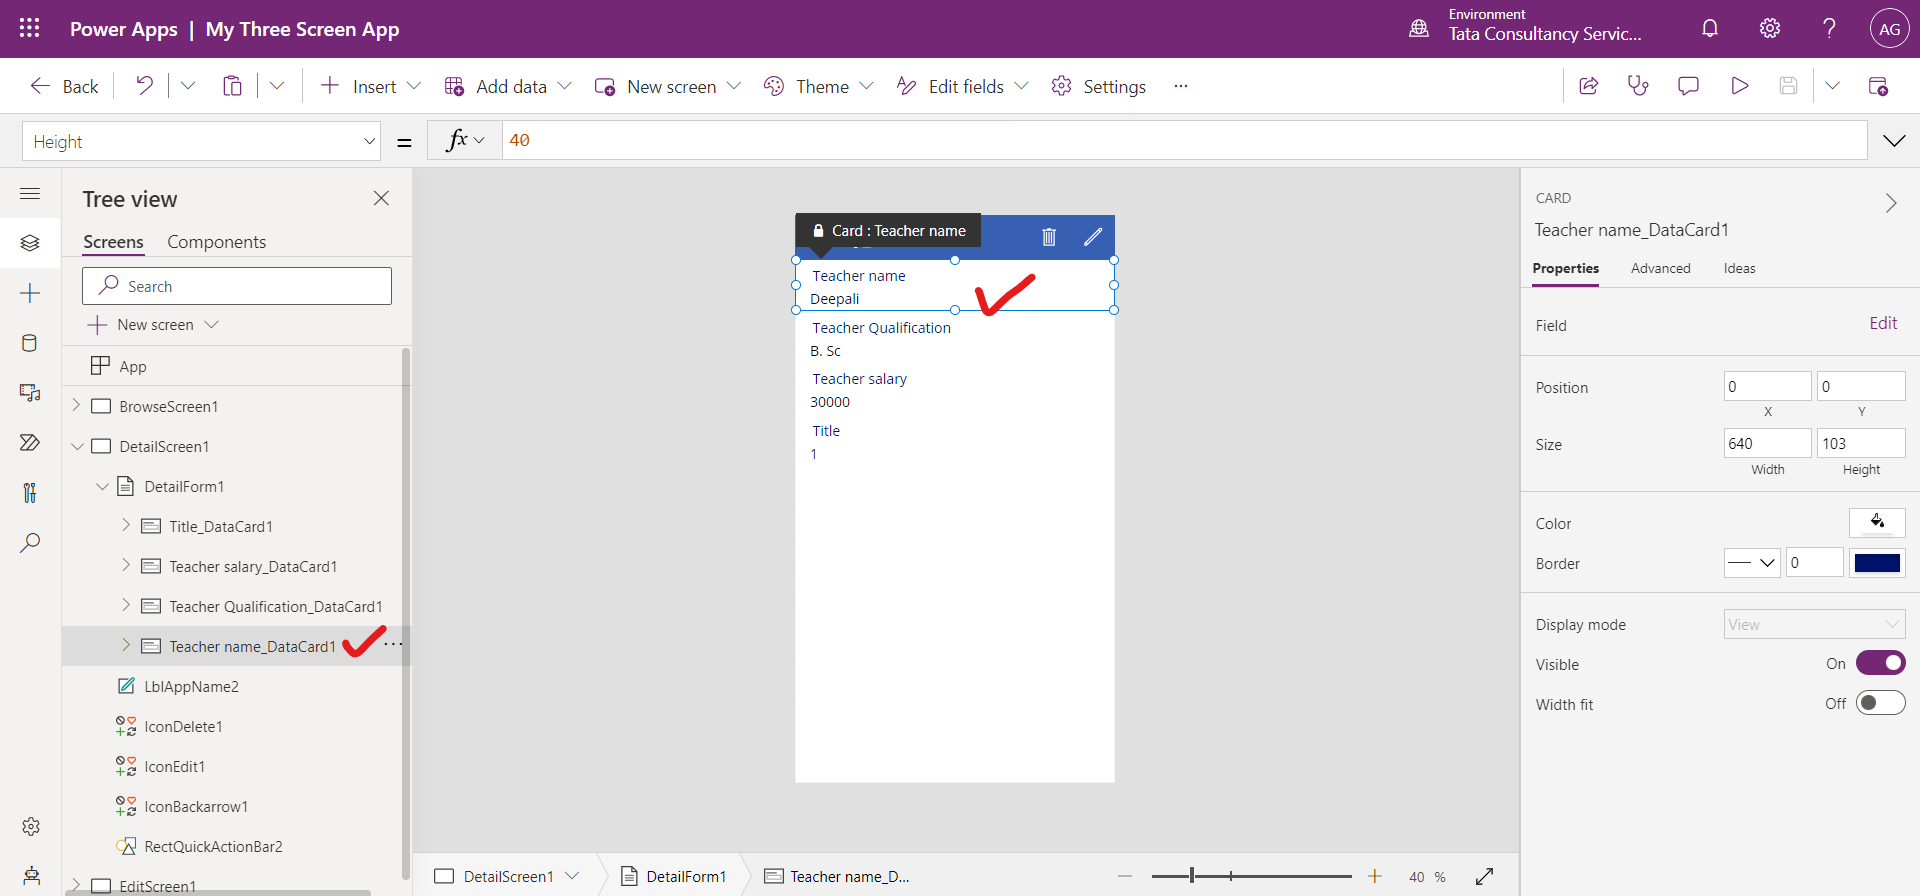
For example: A Teacher name_DataCard1 is a Cardcontrol, automatically created when a form is added into our app. Each card represents a single column of the row.
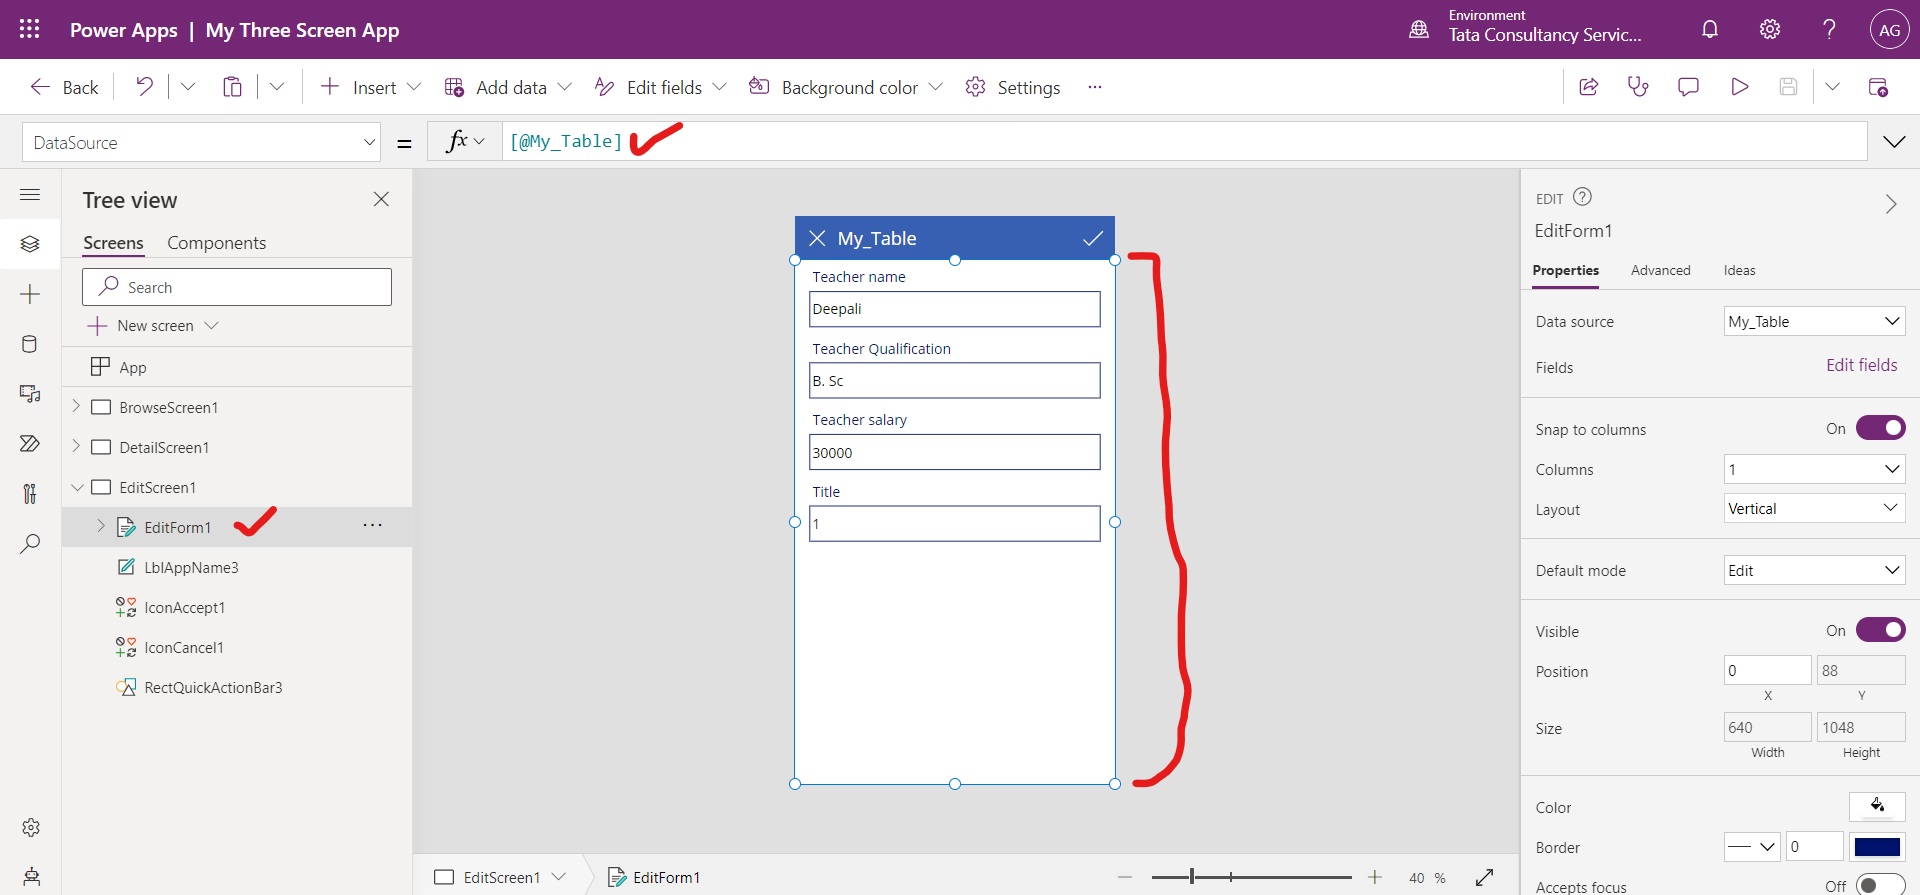
3. Edit/create screen The third screen in the app is EditScreen1. In this screen, we can edit an existing item or create a new one.
Some of the edit screen controls include:
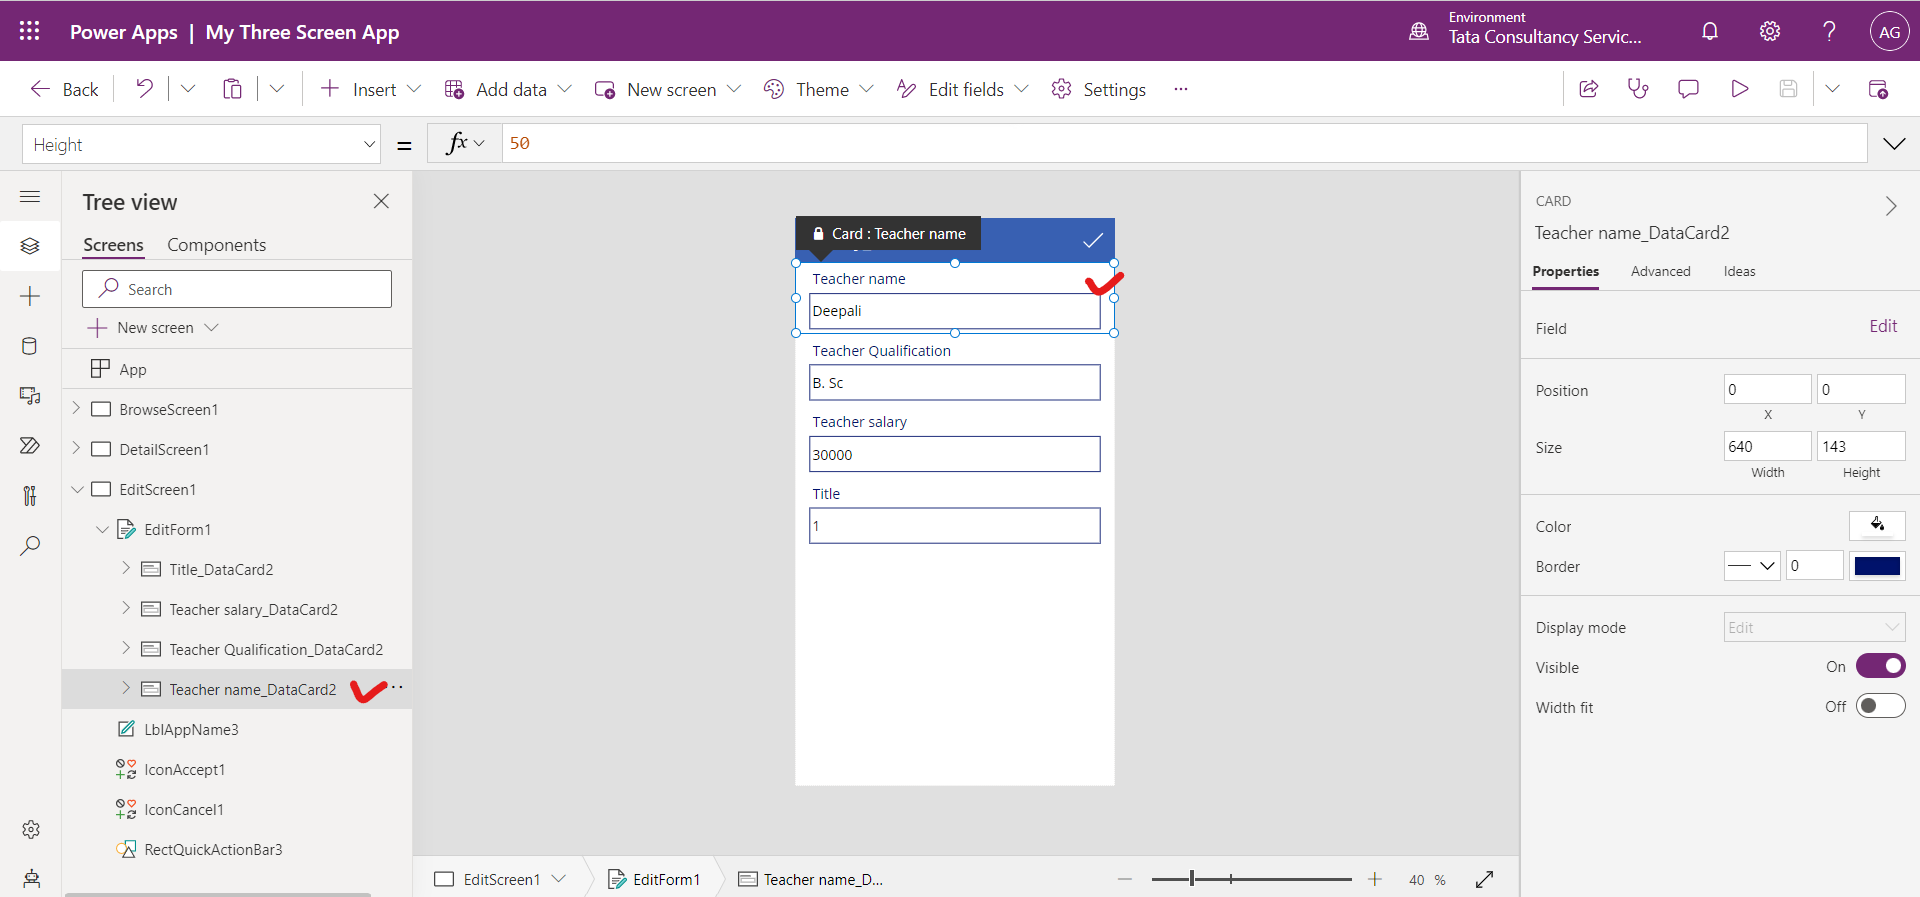
• EditForm1 A Form control containing other controls, and it contains a data card for each column of the row that is being edited.
For Example: A Teacher name_DataCard2 is a card control that shows a teacher name from the table.
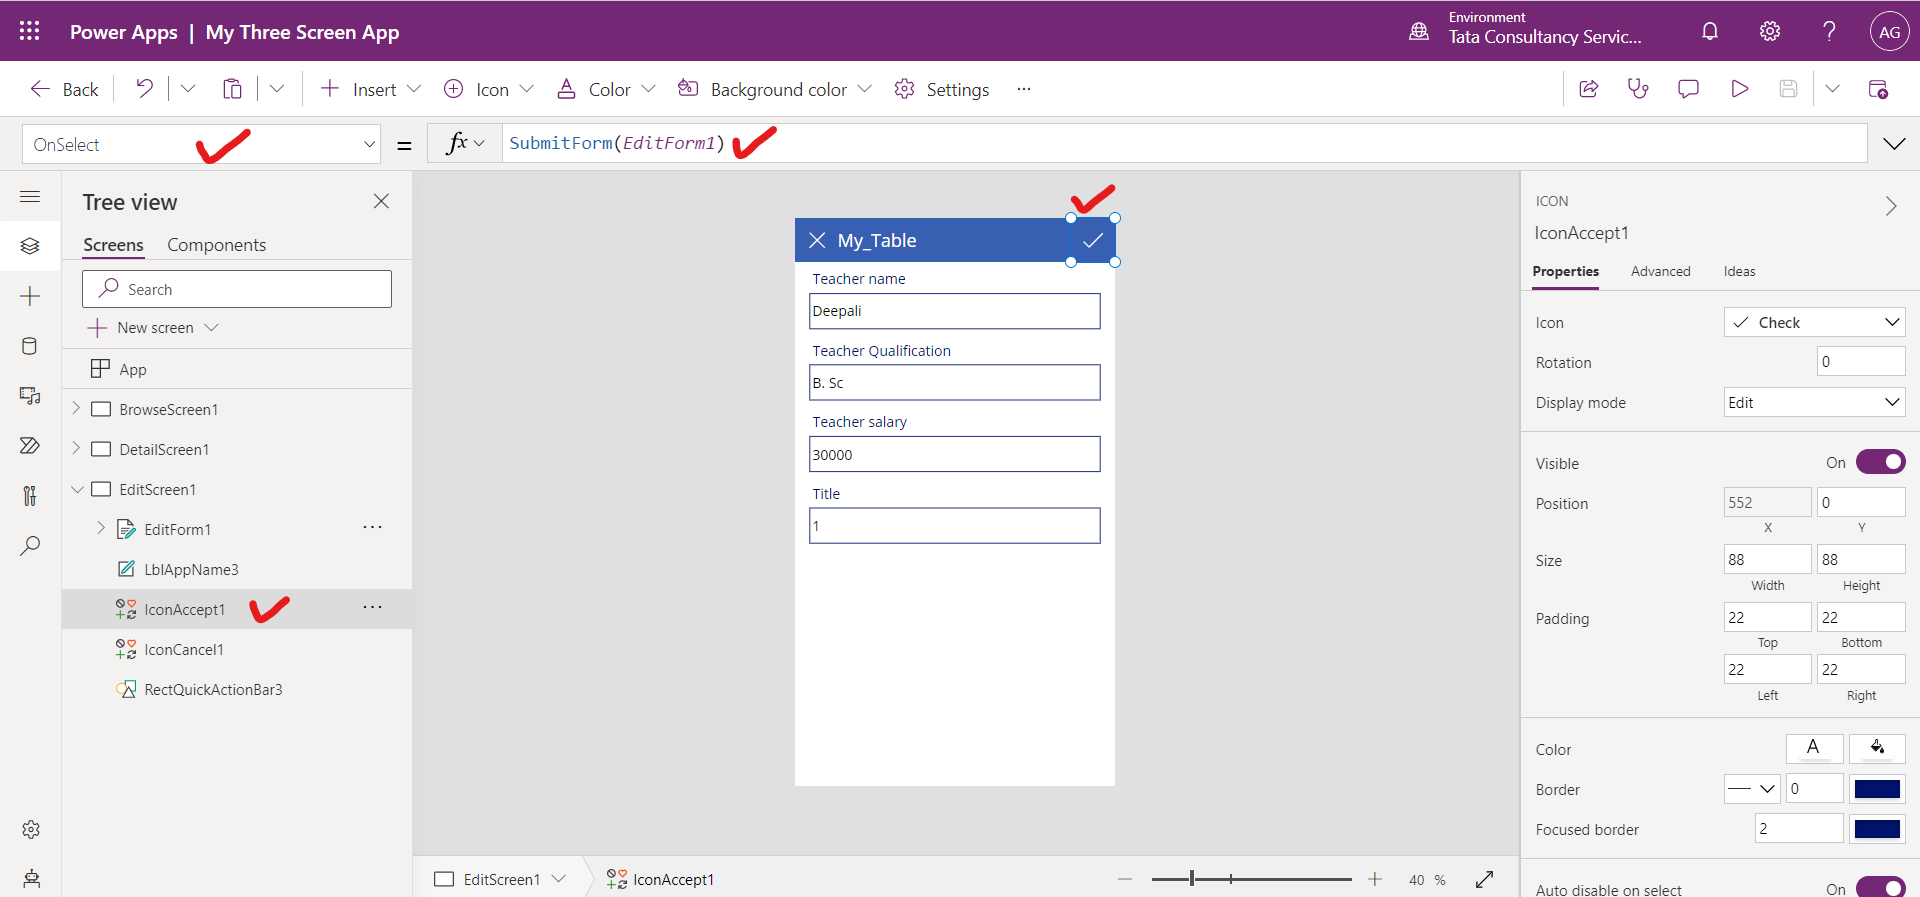
• IconAccept1 It is an icon control that saves the user's changes when selected. The following power apps formula is written on the OnSelect property of the icon control
Power Apps Formula
