Table Visual in Power BI
In this exercise, we will create a table visual in Power BI Desktop.
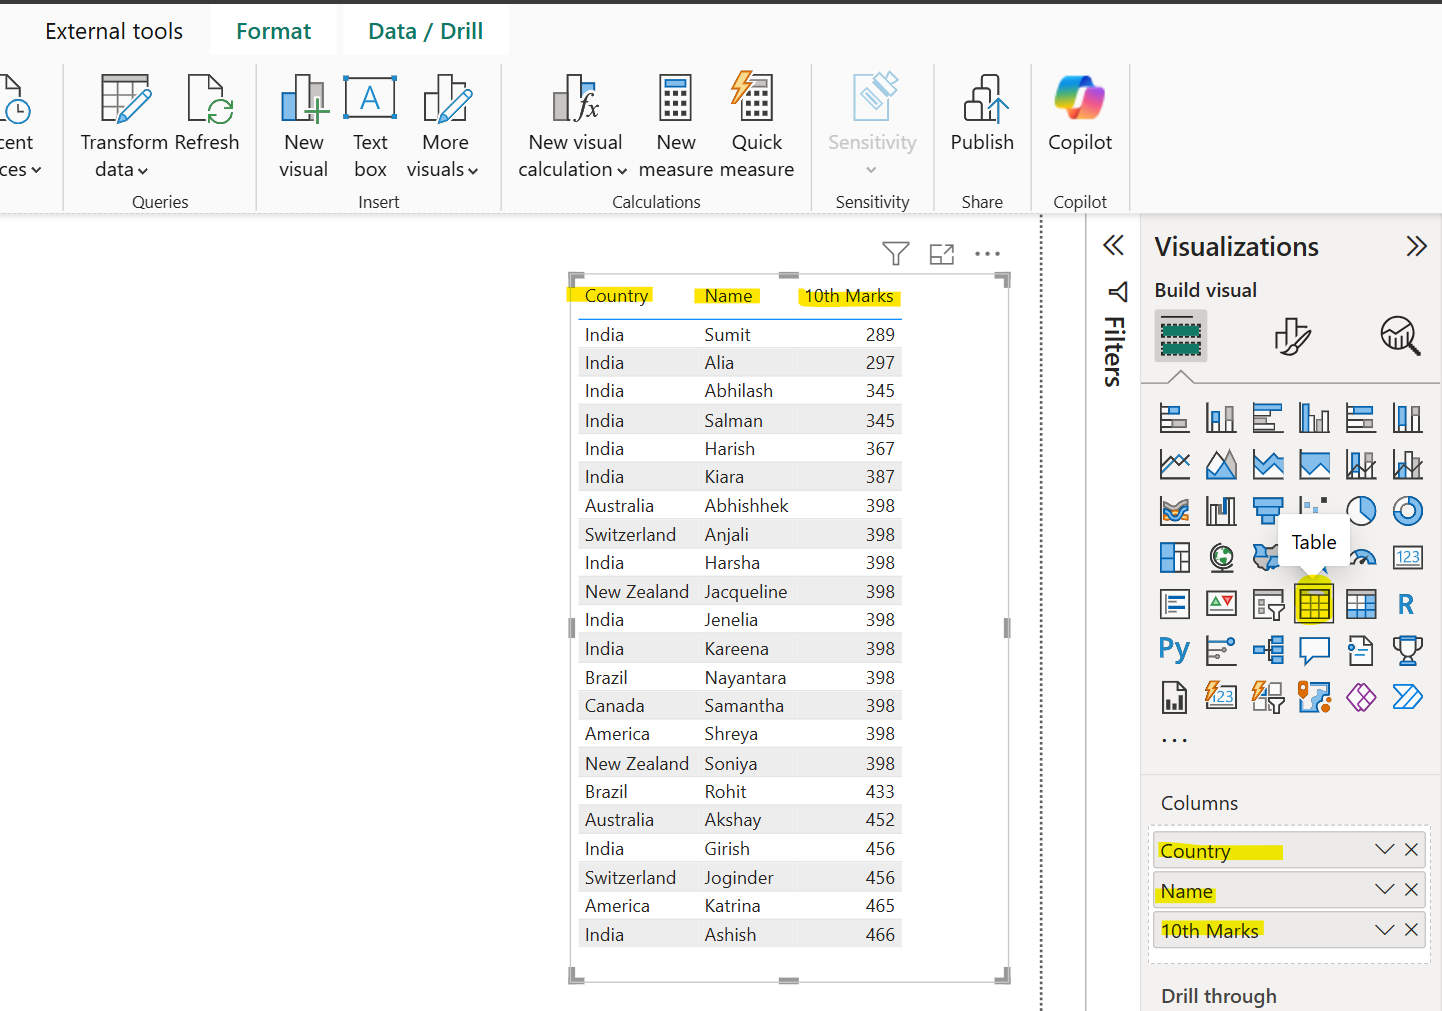
Step 1: We can add a table visual from the visualization pane and add some data fields from the table in the Columns section shown in the image below:

The order of the fields in the field bucket determines the order in which they appear in our table. To move a column on the Visualizations pane, select and hold the field in the Columns section. Drag the field to the new location within the order of columns and release the field. The order of the columns in the table updates to match the new order of the fields in the Columns section.
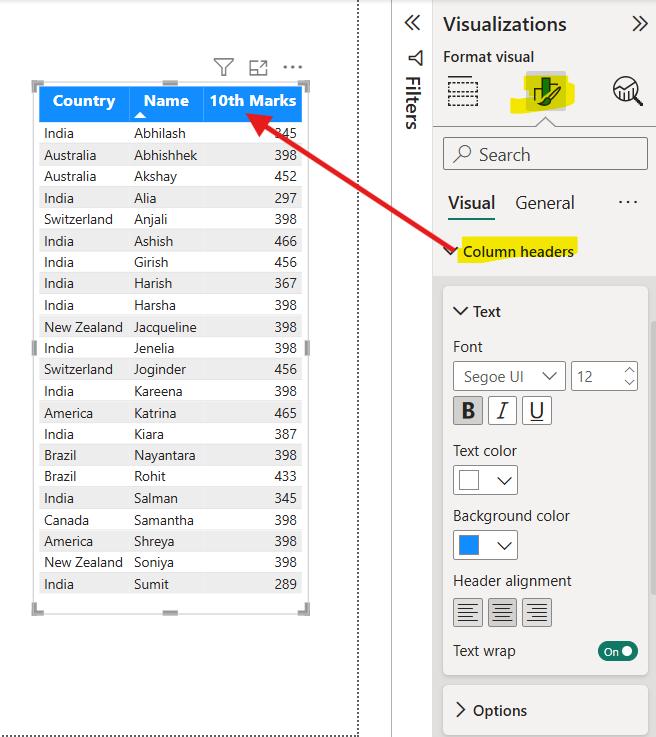
We can manually sort by each column by selecting the column header to switch ascending or descending order. If a column isn't wide enough to display all its contents, select and drag the column header to expand it.
Step 2: We can also format the table visual by clicking on the Format visual icon. The Column headers formatting impacts the columns of the table.

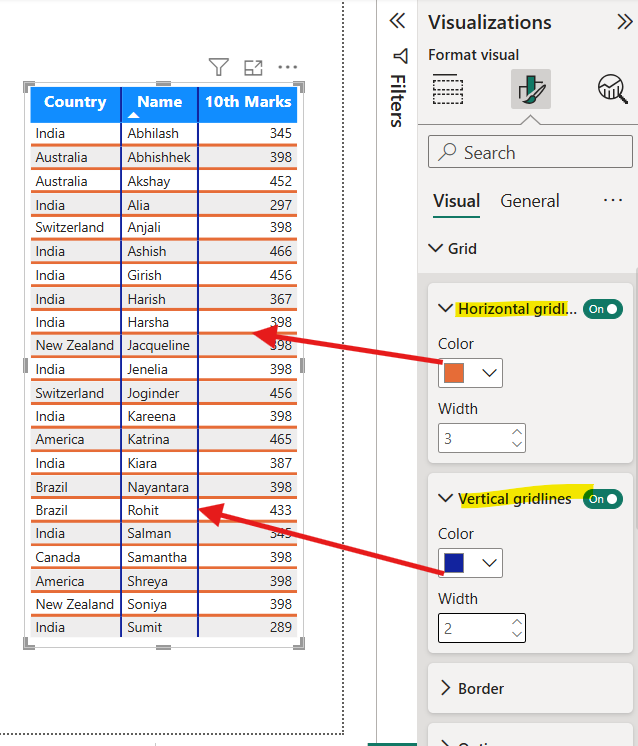
Step 3: We can format the Grid of the table visual (Horizontal and Vertical Gridlines).

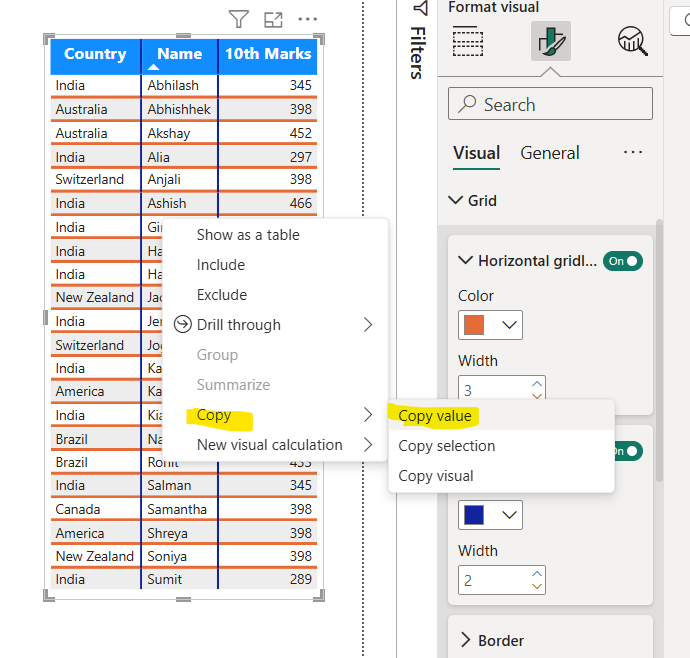
Copy single cell To copy the value of a single cell:
Step 1: Select the cell to copy.
Step 2: Right-click inside the cell.
Step 3: Select Copy >Copy value to copy the cell value to your clipboard.

Note Power BI copies only the data value in the cell. Any formatting applied to the cell value isn't copied.