Grouping and Binning in Power BI
In Power BI, we have two grouping and binning features to group the data and use that for the data analysis on those groups.
1. Grouping in Power BI Grouping is typically used with categorical (non-numeric) fields. It allows you to combine individual categories into larger, more meaningful segments. For example, you might group several product types into broader categories or combine regions into clusters.
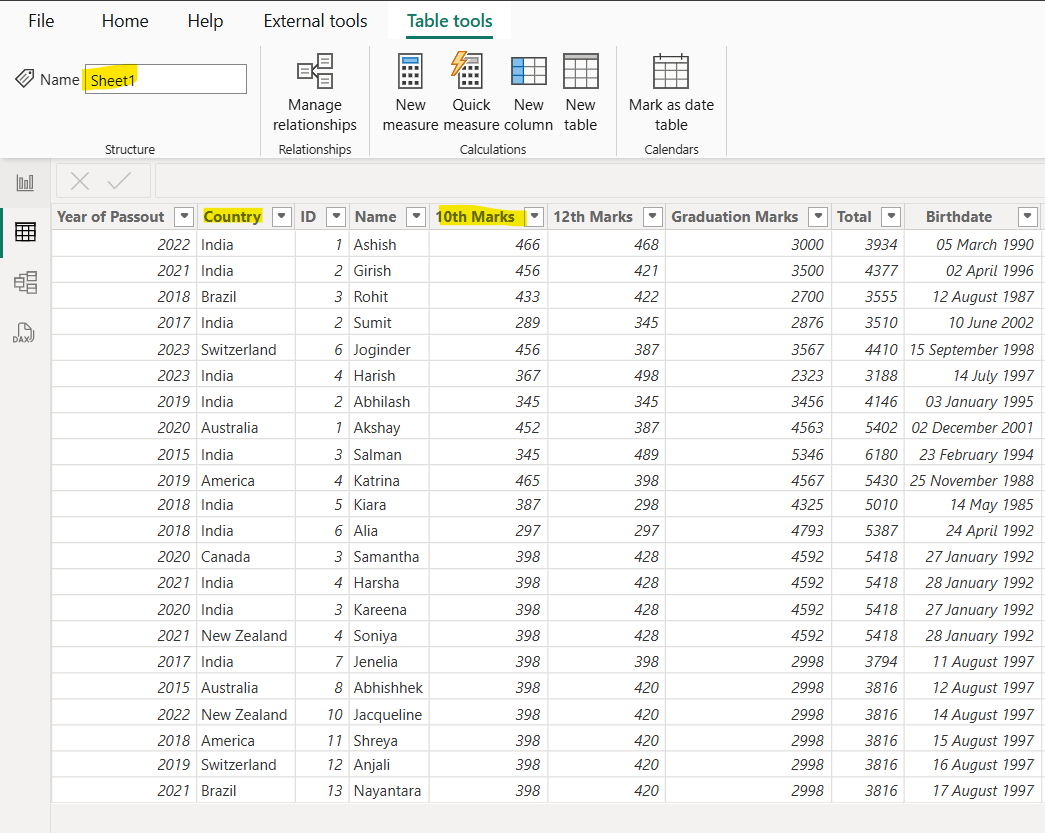
Create a group Let’s have table in Power BI named “Sheet 1” with the following data.
Let’s create a bar chart in which the X-axis is the Country values and Y-axis has the Sum of 10th Marks values.
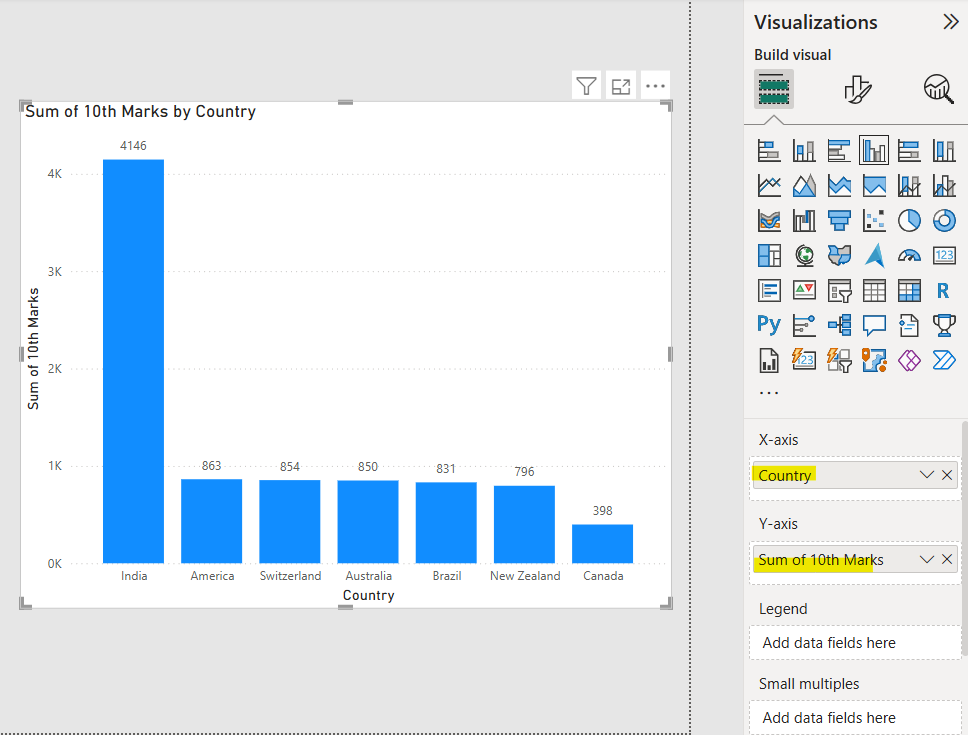
Now we want to group the countries according to their regions and want to show the values based on the group.
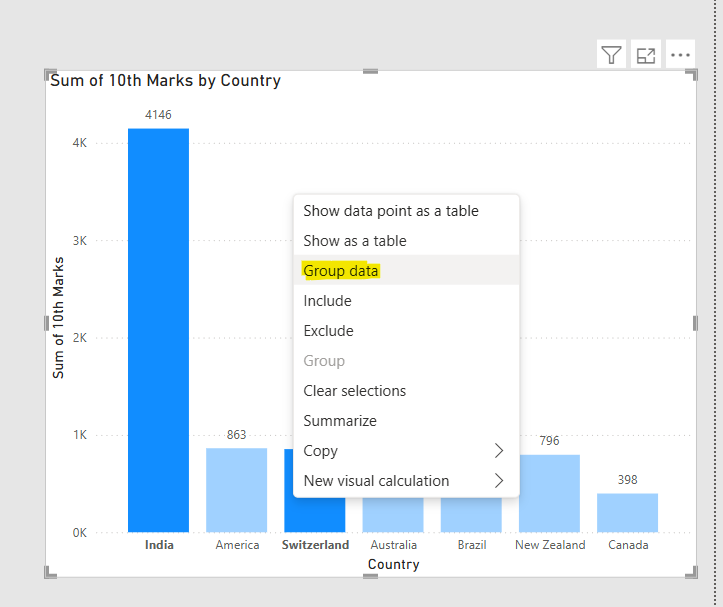
Step 1: To create the group, select two or more elements on a visual by using Ctrl+click to select multiple elements that we want to group. Then right-click one of the multiple selection elements and choose Group data from the context menu.
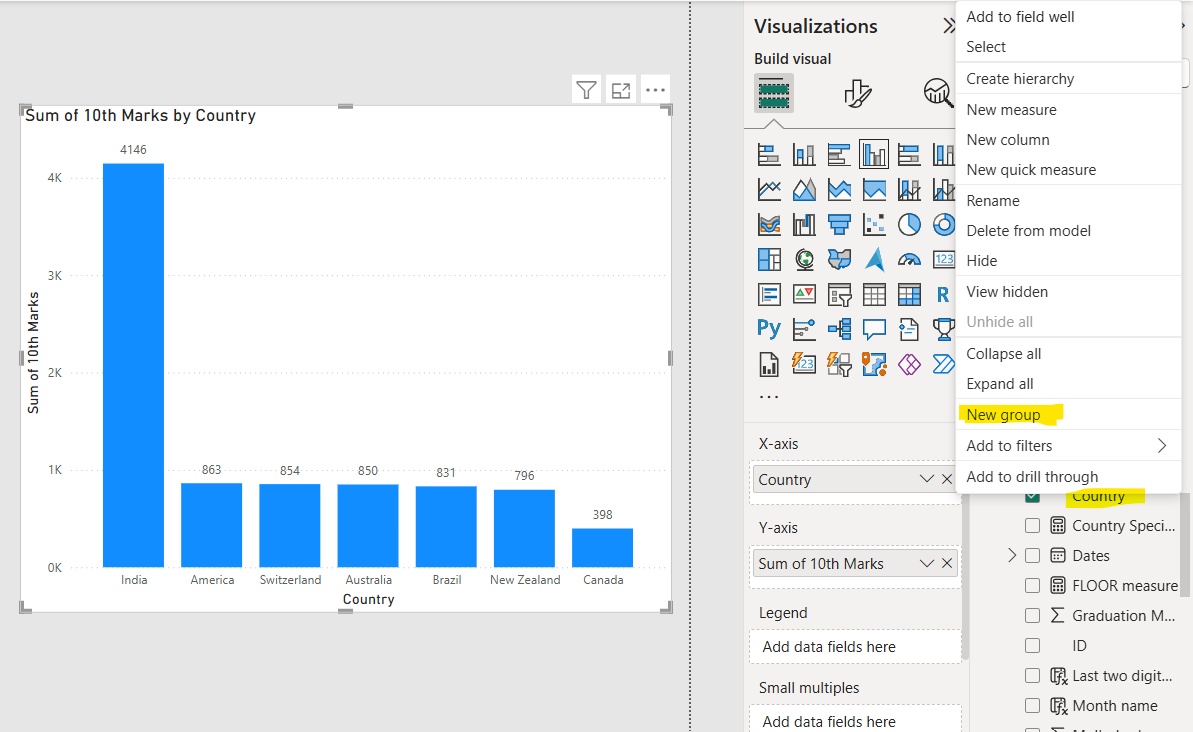
Alternatively, we can create groups for any field in the Data well, without having to select multiple items from an existing visual. Just right-click the field and select “New group” from the menu that appears.
Step 2: After clicking on “New group”, the following window appear. Here, we can type our Group name, and grouped the values.
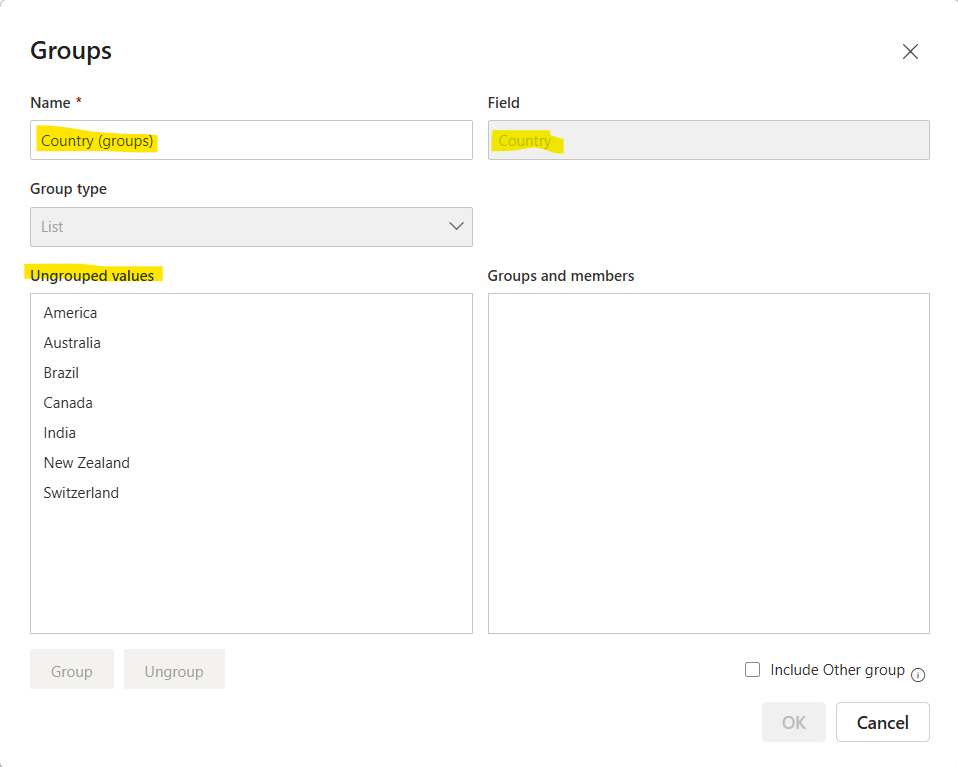
Press the Ctrl key and then select the multiple values, and then select the Group button.
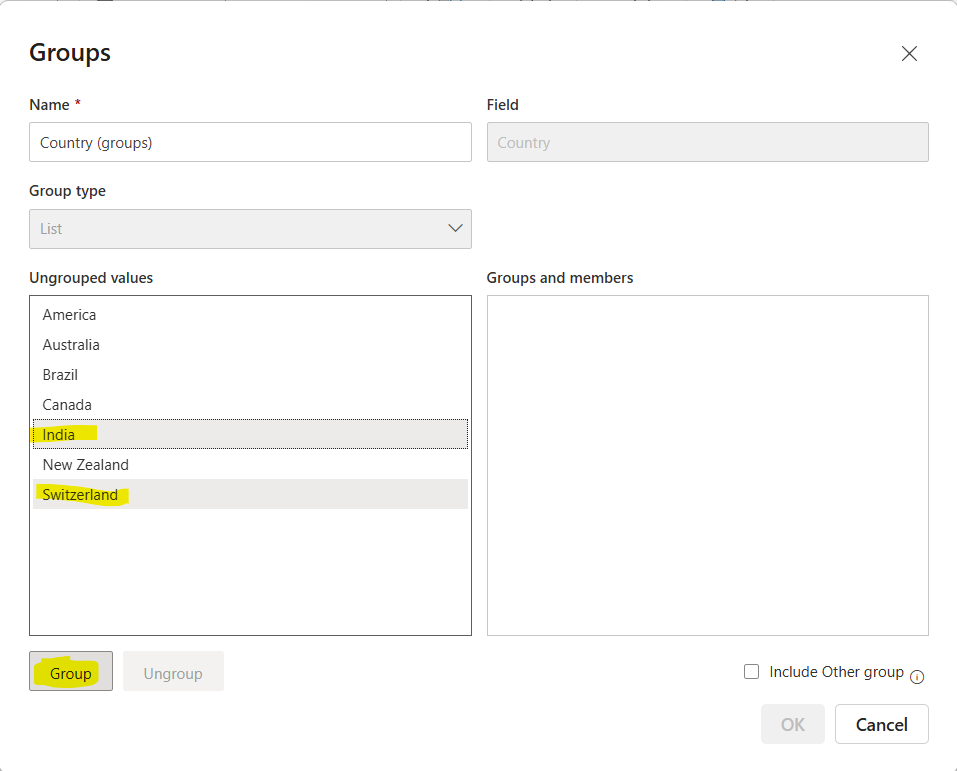
In the following image, we can see one group is created. We can also change the group title by double-clicking the group title in the Groups and members section and entering a new name, which is highlighted in the following image.
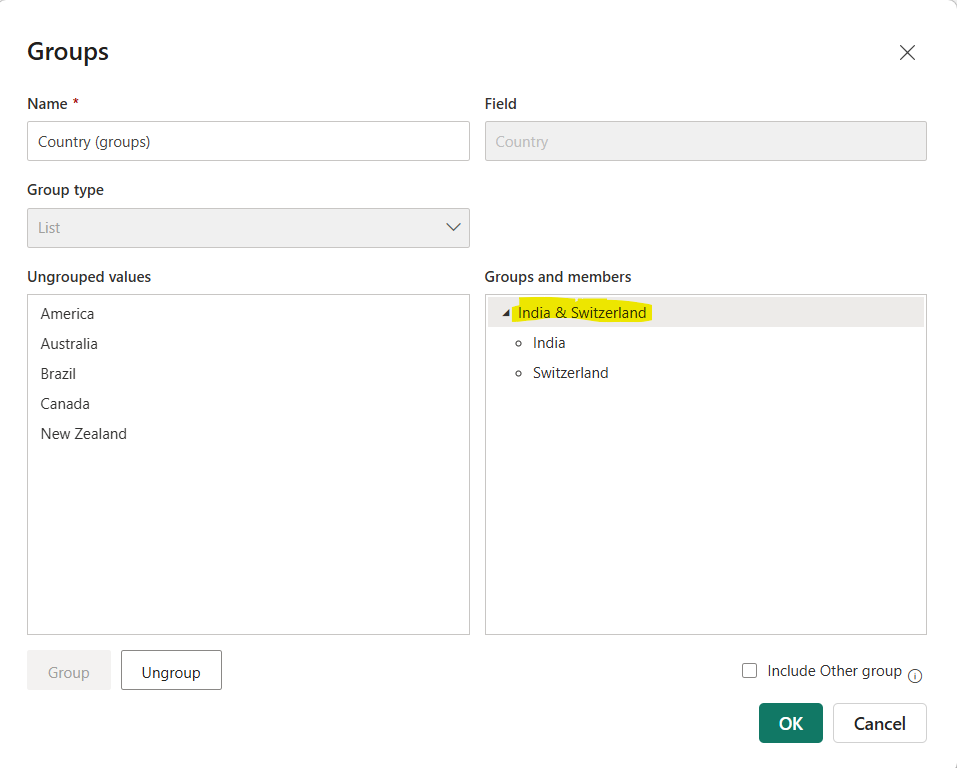
Similarly do the other groupings and we can also have the option to select “Include Other group” if the value is not considered in the any groups of the countries, it goes in “Other” group.
Click on Ok to save the change and create the group.
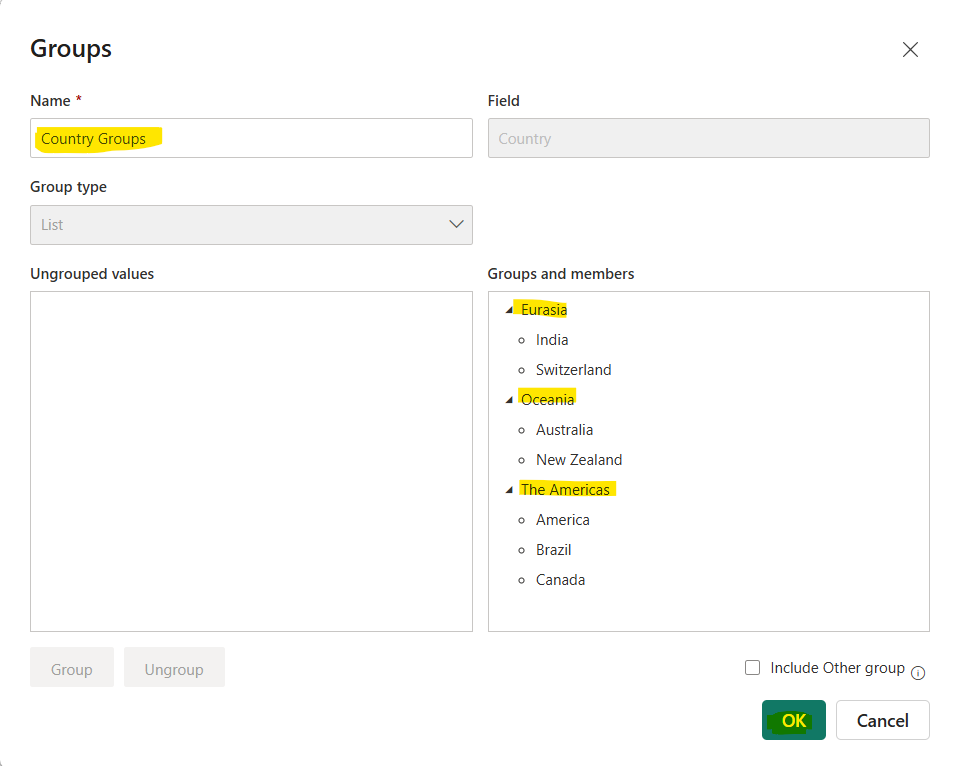
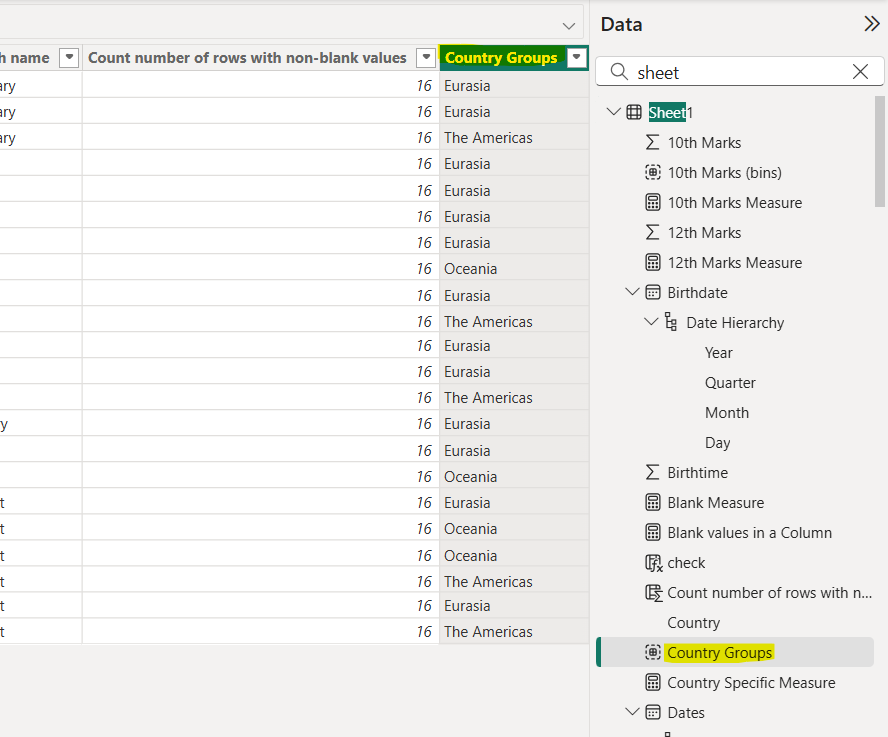
Now let’s replace the Country field from the X-axis with the Country Groups.
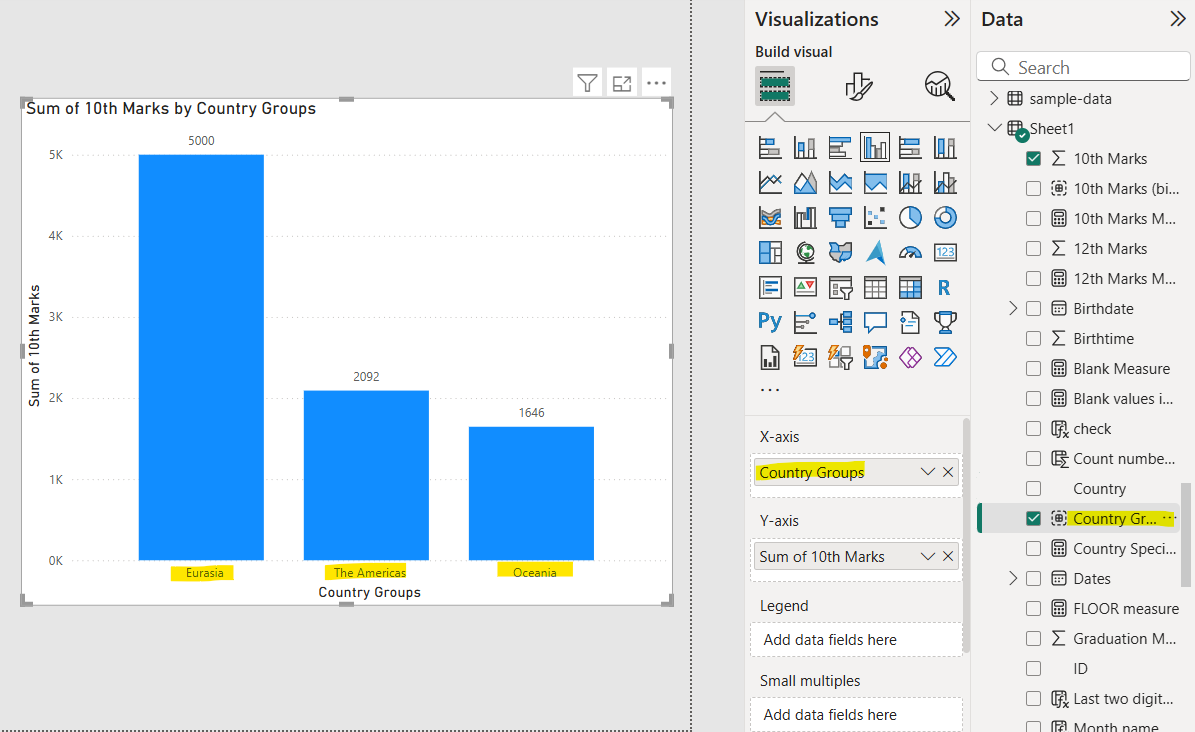
Note: We can use this Country Groups column now in the Legends also. We can also use this to create the hierarchy in the Power BI.
To create hierarchy, right click on the field and click on the Create hierarchy.
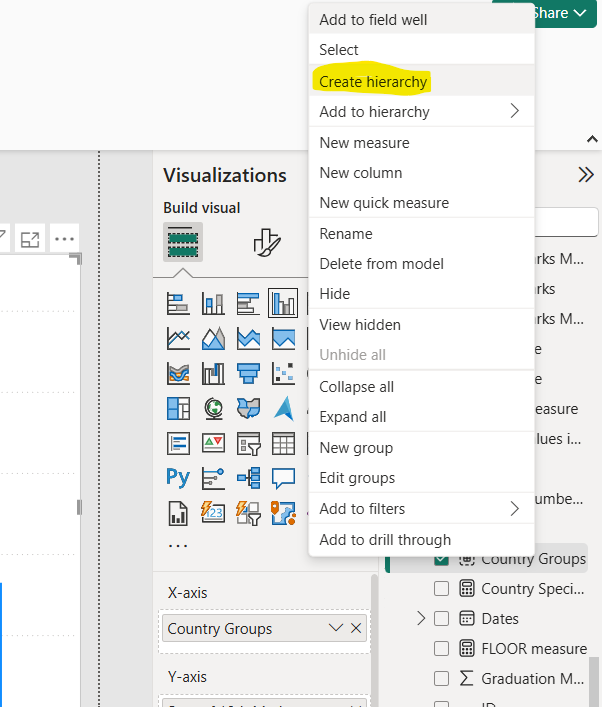
Edit the Groups in Power BI To edit the existing groups, right-click on the group and then click on the “Edit groups” option from the context menu.
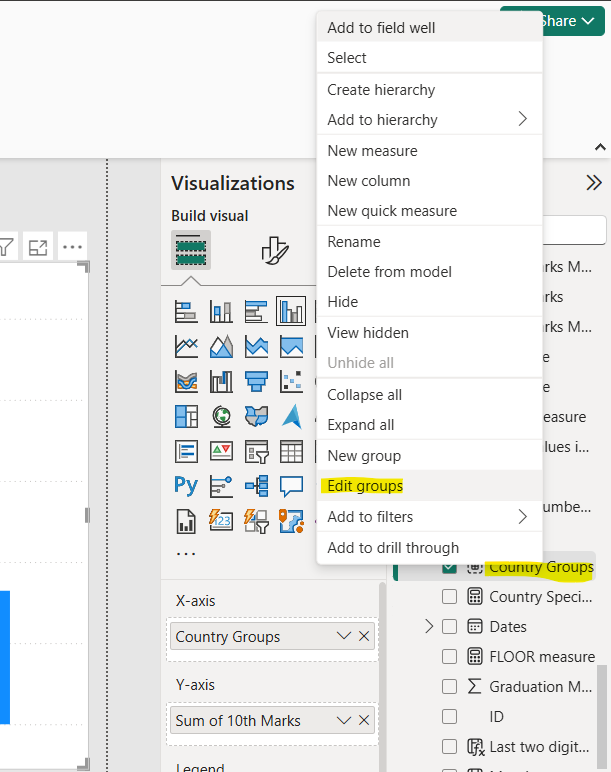
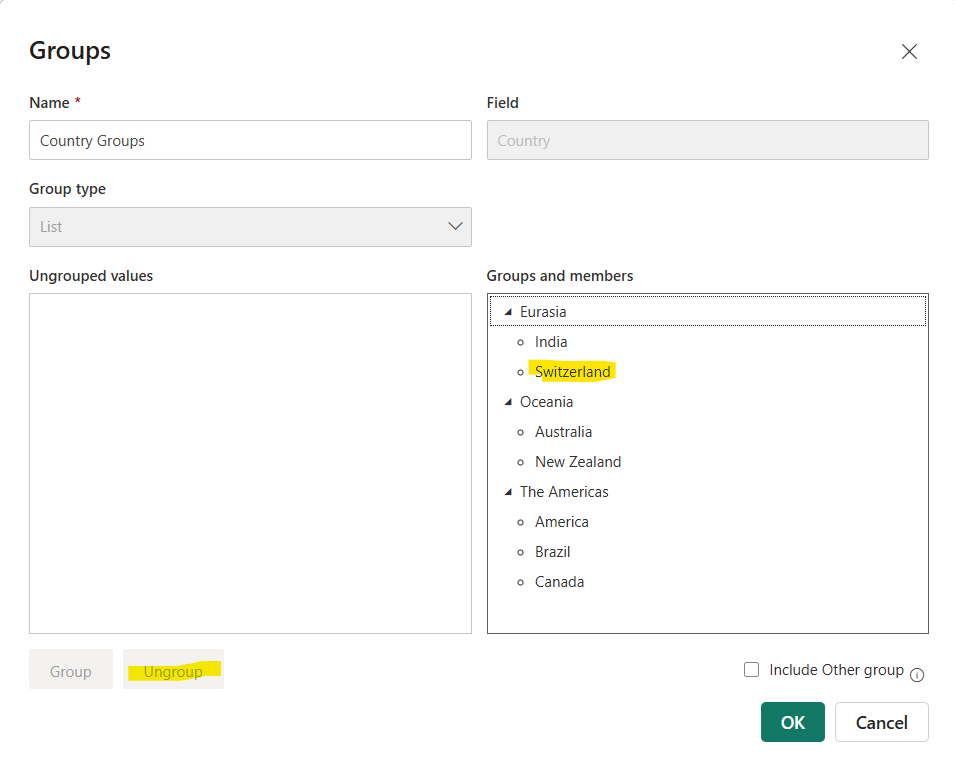
The following window appears. To ungroup any member, select the member and then click on the Ungroup button. If we want to ungroup the one group, then select the group and then click on the Ungroup button to ungroup all its members.
We can also change the name of the Group itself by specifying the new name in the Name box and click on Ok button.
Note: • We can use different formatting style for different groups.
• In the backend the groups are nothing but like the calculated columns created in the table.
2. Binning in Power BI Binning is used with numeric/date/time fields to break continuous data into discrete ranges (bins). The process of binning allows us to group our numerical and time field data into "bins" of equal size. Binning allows us to right-size the data that Power BI Desktop displays. We can make bins for calculated columns, but not for measures.
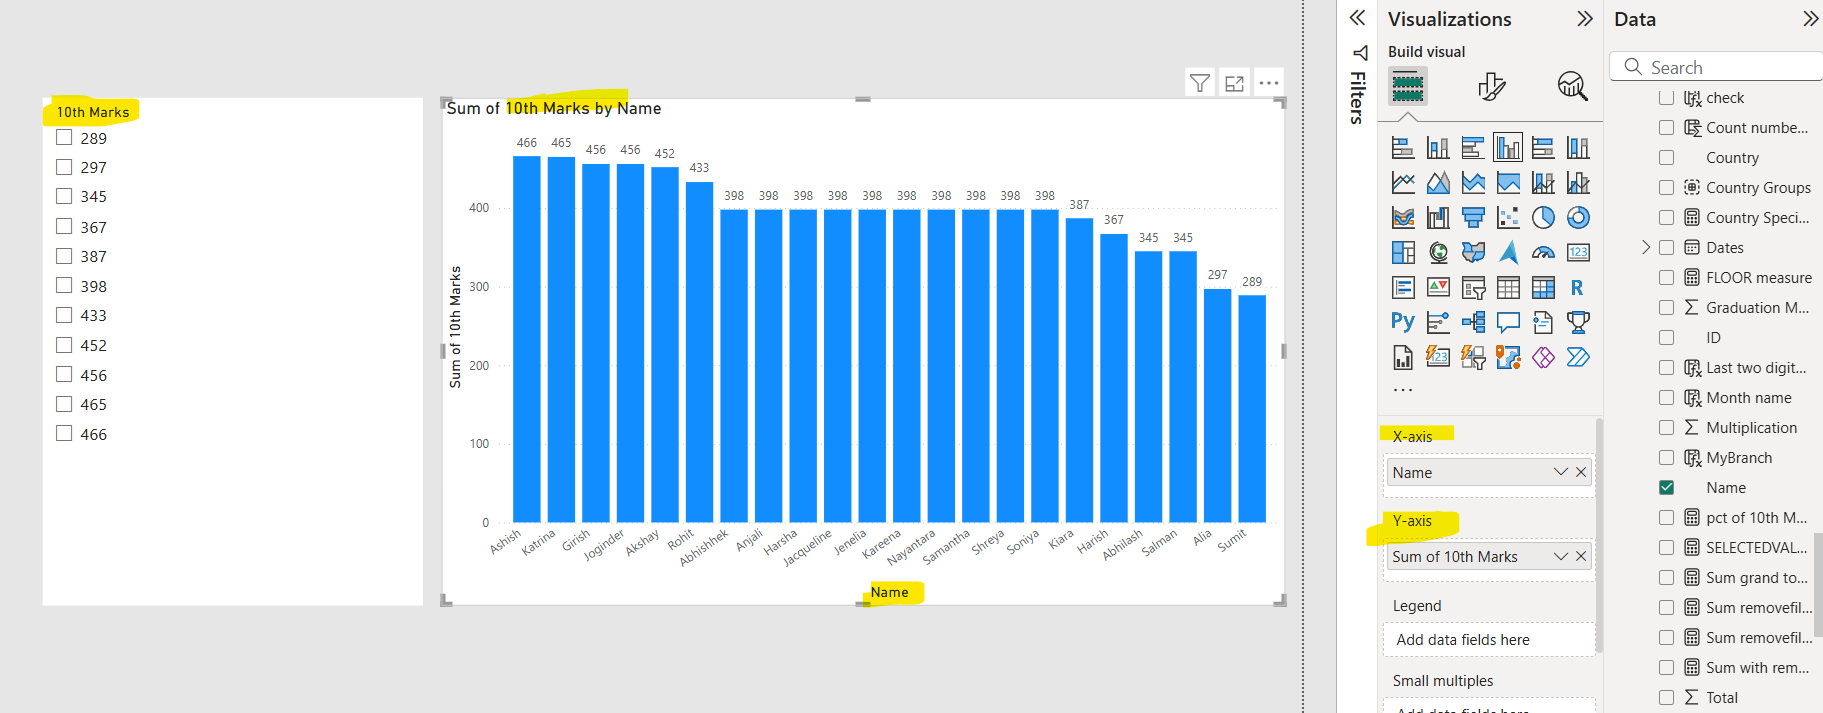
Let’s create a column chart and a slicer in the power BI. In the Column chart add the Name field in the X-axis and Y-axis we have added the 10th Marks column values. In the slicer add the 10th Marks column values.
Now when we select the slicer value the column chart is filtered on that value, as shown in the image below:
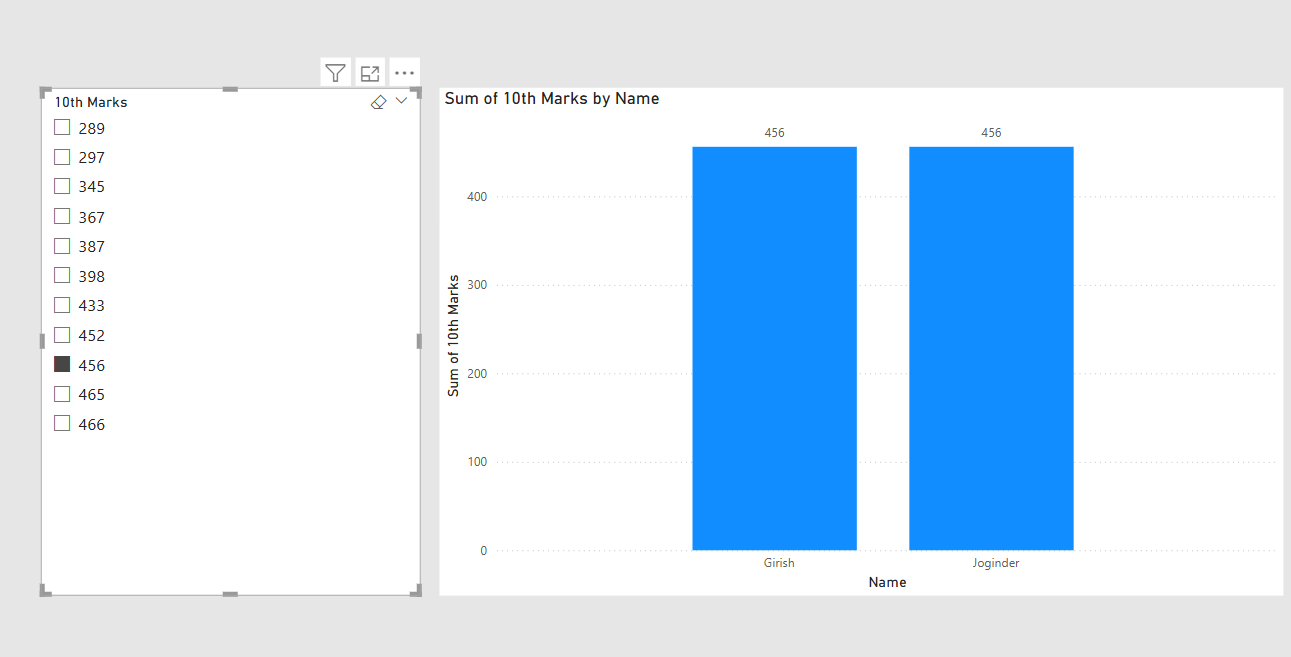
So, with Marks 456 we have two names as shown in the image, but now our requirement is to create a range of marks instead of individual marks. To create that range, let’s do the binning of data in Power BI.
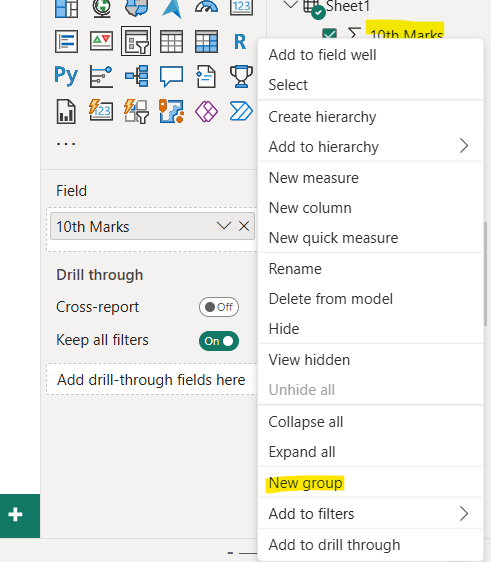
Step 1: To apply a bin size, right-click on the 10th Marks field and choose “New group”.
Step 2: On the Groups window that displays, set the Group name.
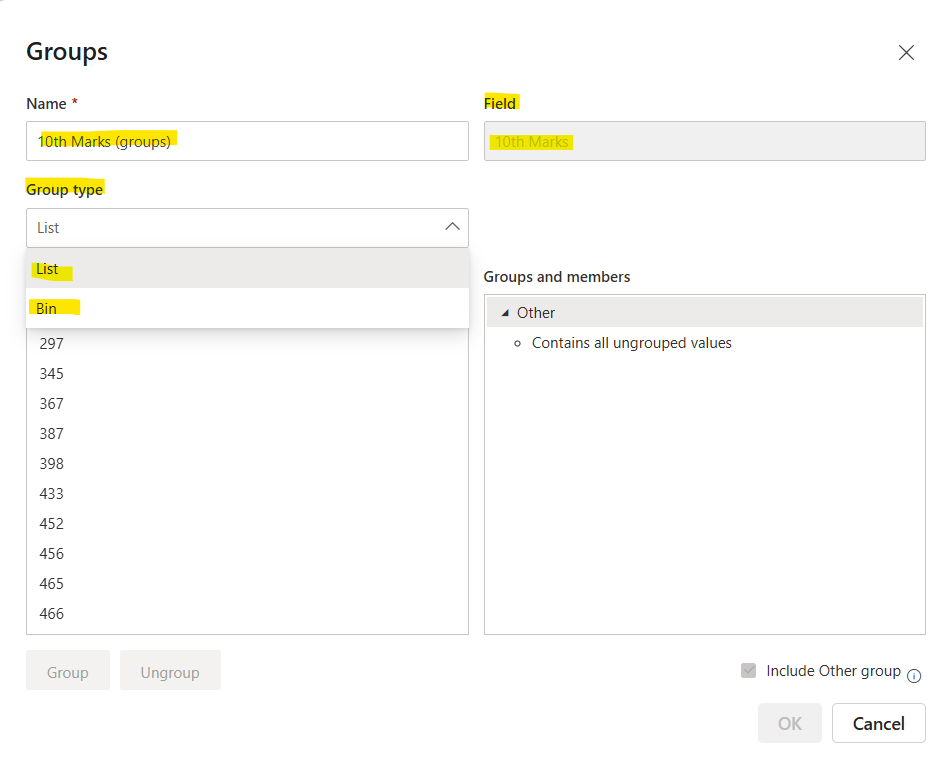
In the Group type, we have two options:
• List
• Bin
When we select the Group type Bin. Then we have two options in the Bin type:
• Size of bins: Change the interval width to suit our analysis.
• Number of bins: Alternatively, decide on a fixed number of bins; Power BI will calculate the appropriate bin size.
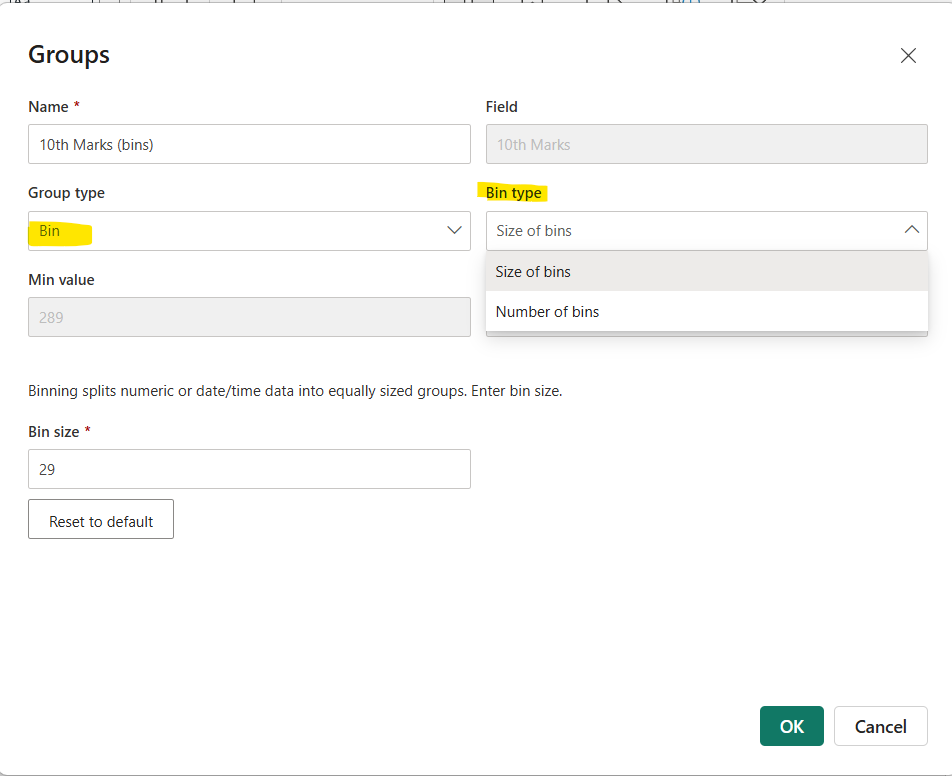
We can see the Min value and Max value from the field. Let’s set the Bin size that we want, and then select OK.
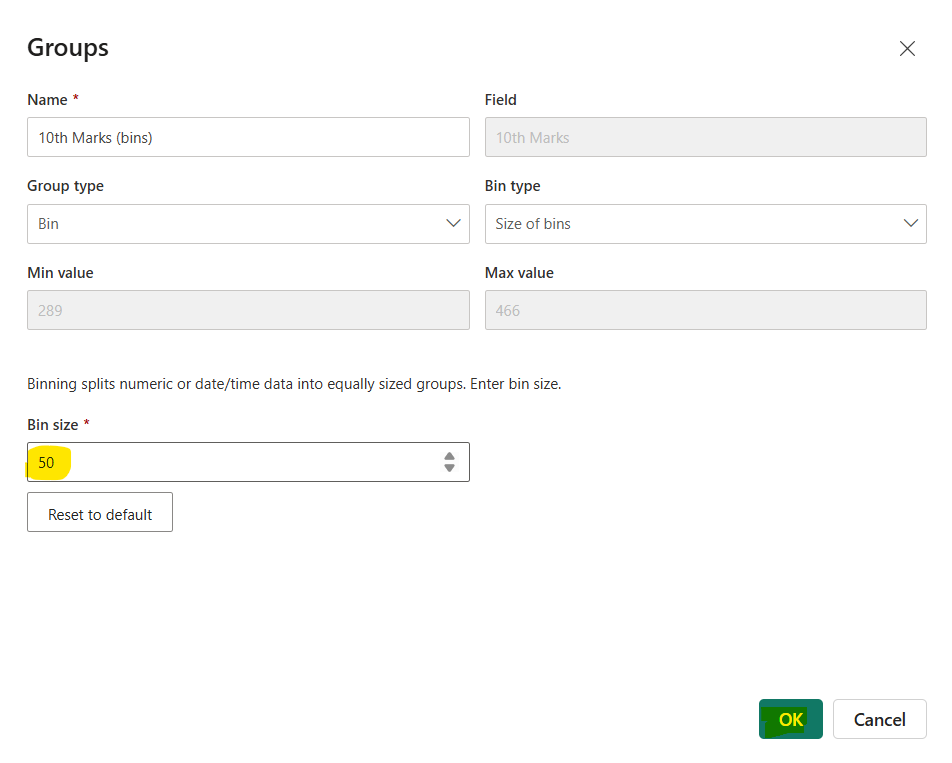
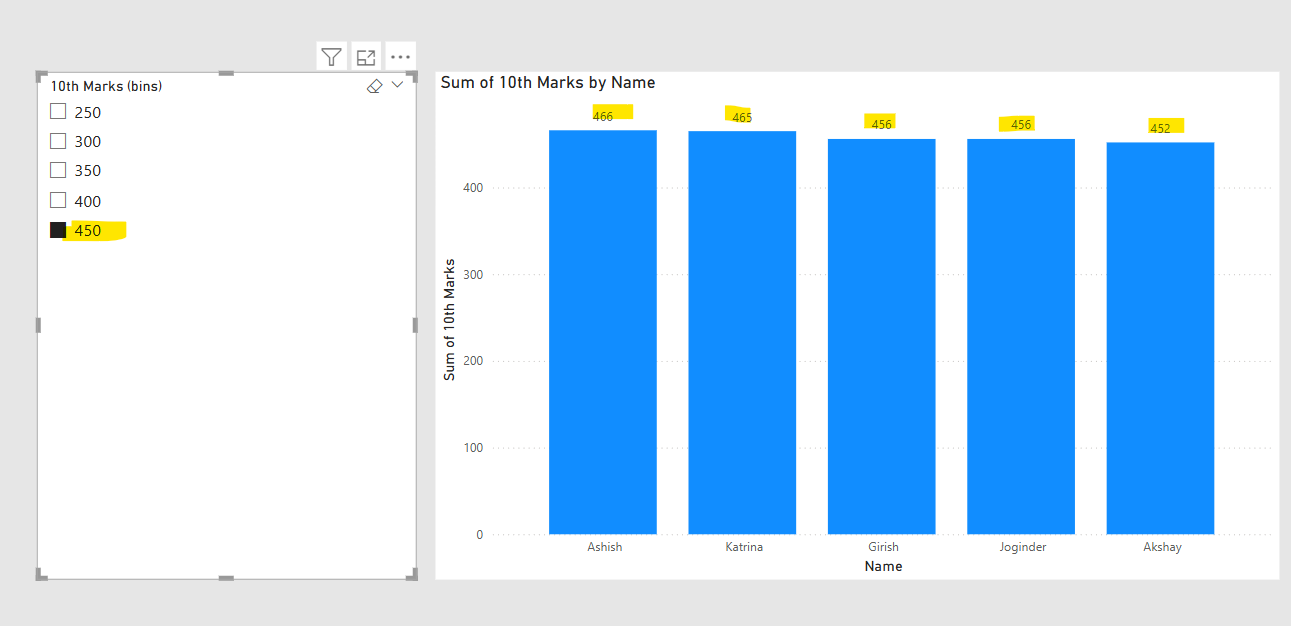
Now let’s add the binned group to the slicer. We can see the range inside the slicer, as shown in the image below:
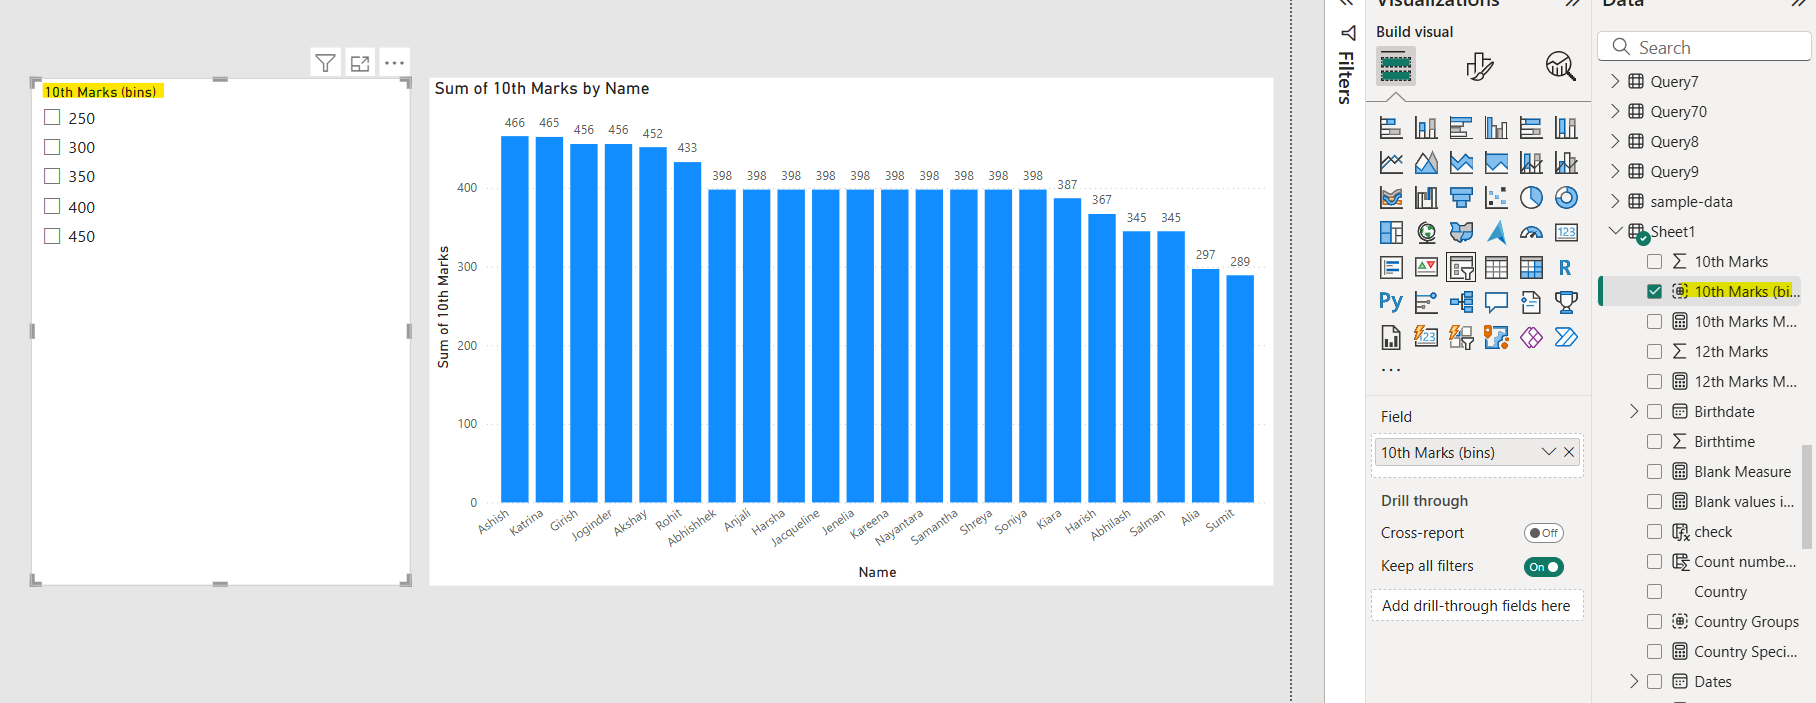
Let’s select a value from the slicer, we can see all the value from that range. Here 450 value means 450 + 50 (bin size).
Custom Binning with DAX For more complex binning logic, we can create a calculated column. • Use FLOOR for fixed-width bins Example:
Power Query M
SalesBin =
VAR BinSize = 1000
RETURN
FLOOR('Sales'[Amount], BinSize)
This creates bins with a width of 1000, where each sale is grouped into the appropriate bin based on its value.
• For variable-width bins:
Power Query M
Custom Bin =
SWITCH(
TRUE(),
[Value] < 50, "0-50" , [Value] < 100, "50-100" , "100+" )
Time-Based Binning Group dates into weeks/quarters using WEEKNUM or QUARTER functions. • Example for fiscal years:
Power Query M
Fiscal Year =
IF(
MONTH([Date]) >= 7,
YEAR([Date]) & "-" & YEAR([Date]) + 1,
YEAR([Date]) - 1 & "-" & YEAR([Date])
)