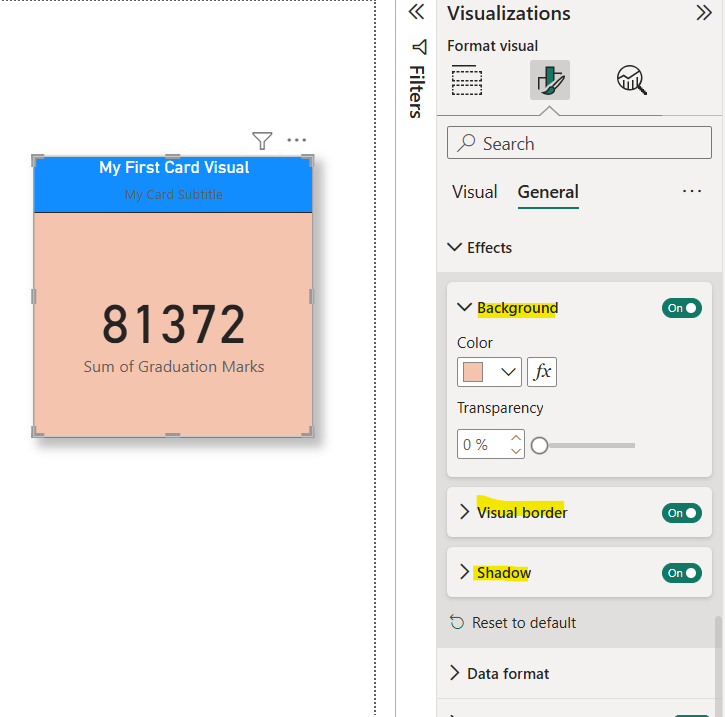
Card visualization in Power BI
We can create a Card visual in Power BI.
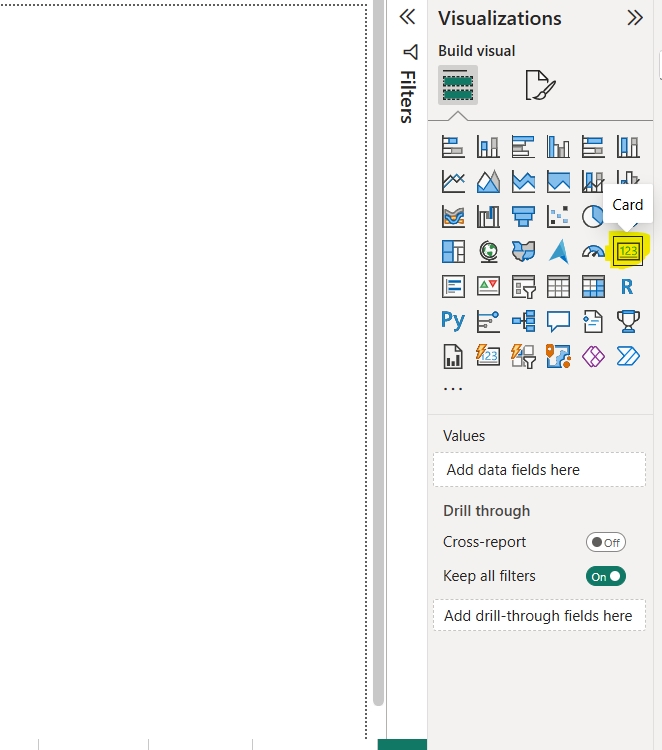
Step 1: To add a Card visual to the Power BI, select the card visuals from the visualization pane.
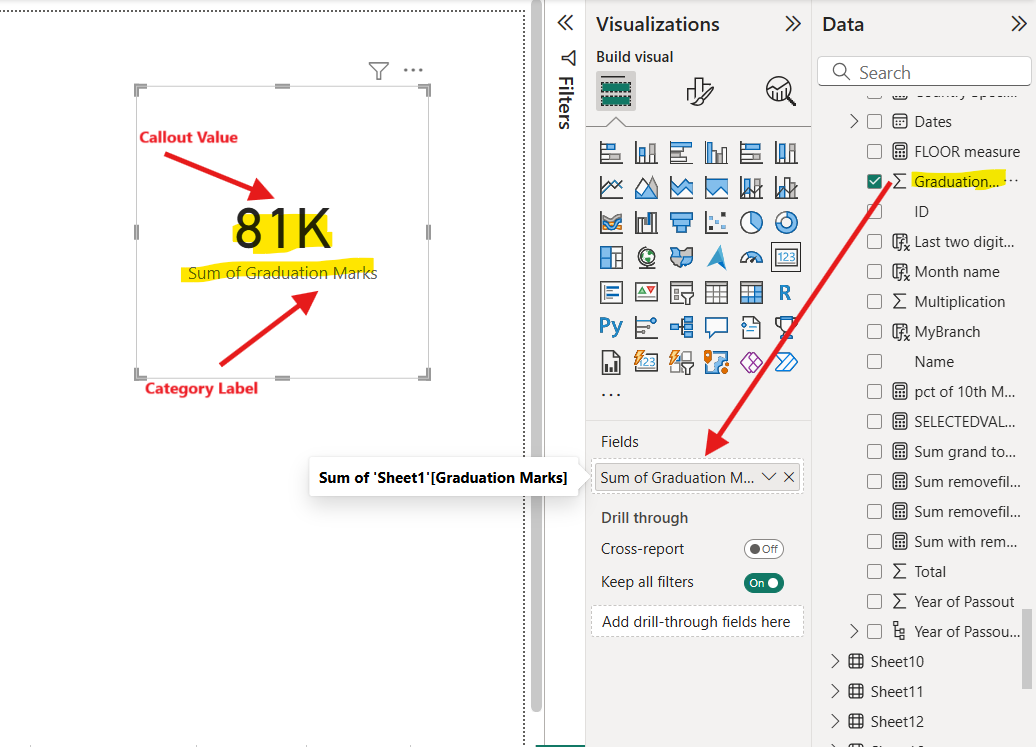
Step 2: The card visual is added on the page. Let’s drag the Graduation marks column from the table to the Fields tab.
Format a card visual Click on the visual, then click on Format your visual.
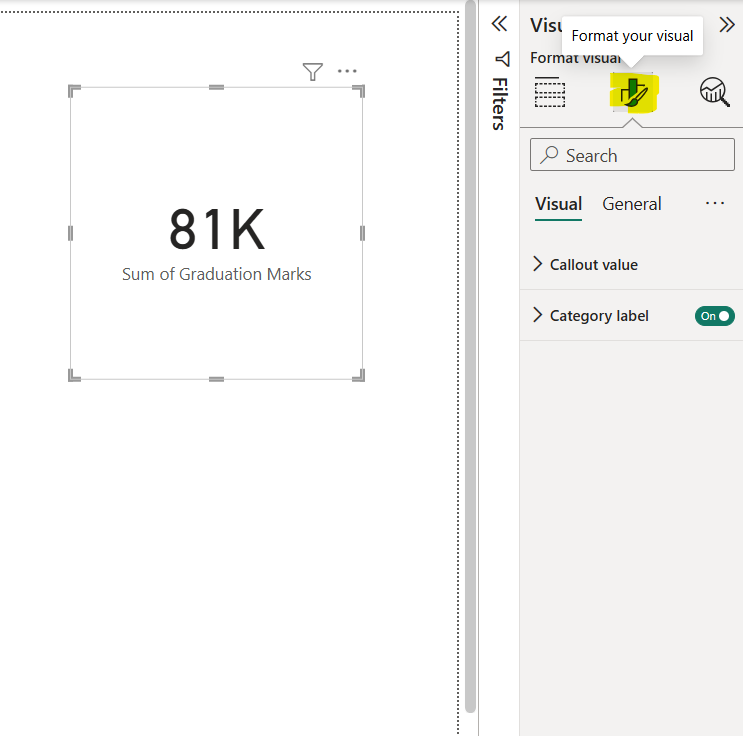
And then click on the Callout value. We have a lot of options for font, display unit, decimal places, and color.
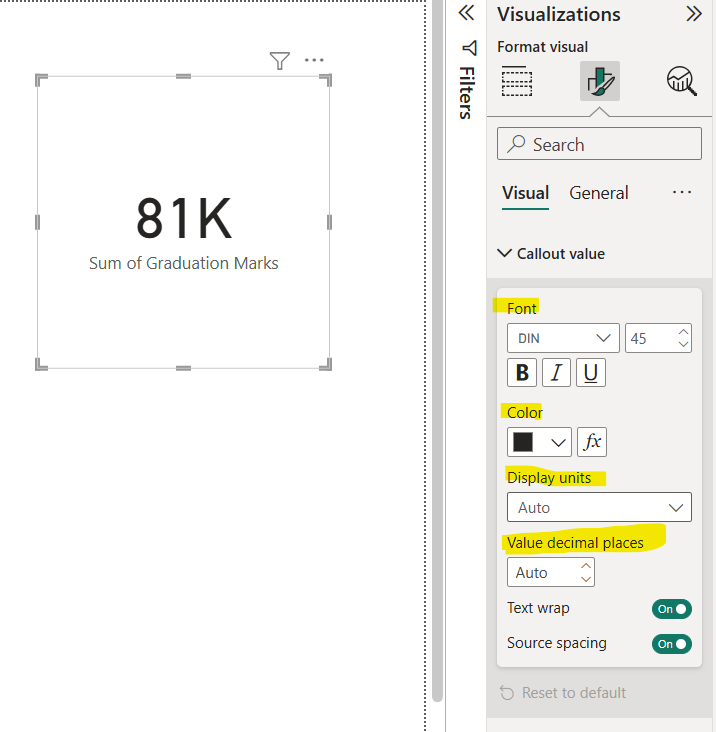
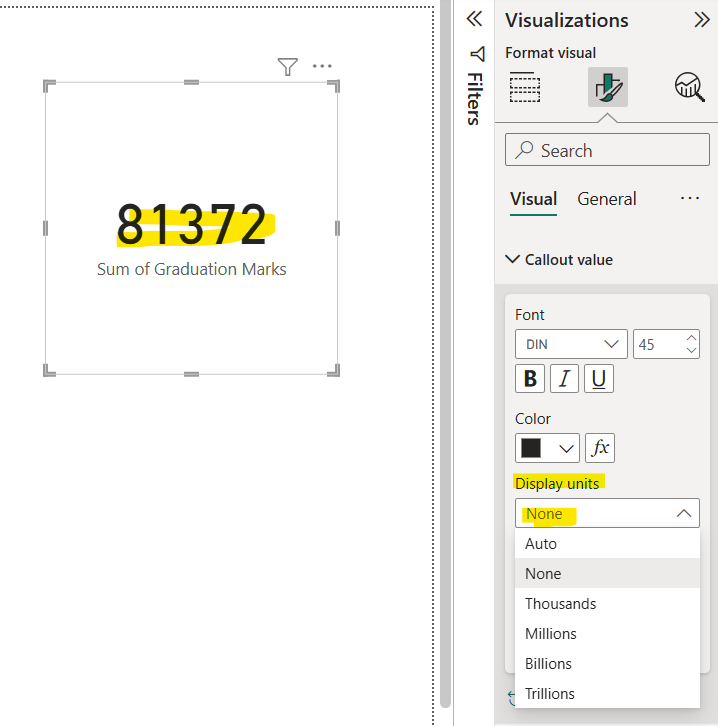
Right now, our Display units is Auto, just select the None in the Display units. After clicking on None, we see the following result.
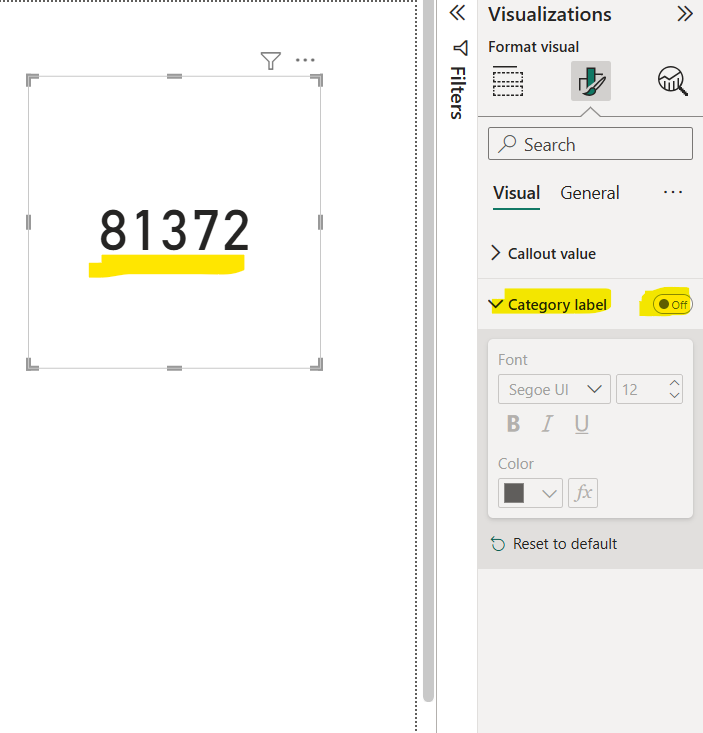
Click on toggle button next to Category label to show and hide the category label. Expand the Category label to format the category label, we can see the font, size, and color options for category label.
Just go to the General option to see more formatting options. Expand the Title option. Click on the toggle button next to Title to show or hide title. Let’s turn it on and specify the Title as “My First Card Visual”.
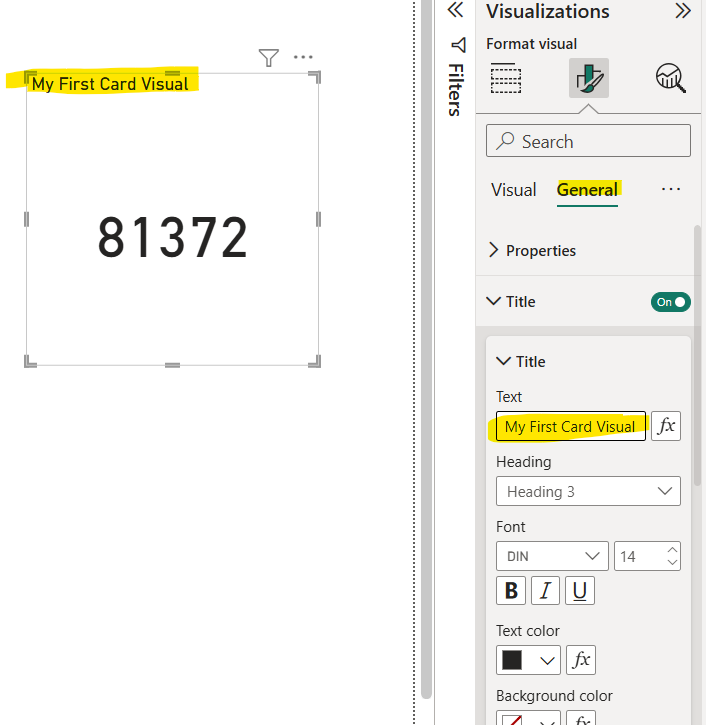
Write the text in the Text column. We can see the various options for title like font, text color, size, horizontal alignment, and background color.
From the Effects section from the General tab, we can set the background color, transparency, visual border, and shadow.
