Introduction to Dashboards
A Power BI dashboard is created by pinning report visuals, and are then called tiles within reports. A dashboard can be created only in the Power BI service. We can also view dashboards on mobile devices, though we can't build them there.
Create a Dashboard
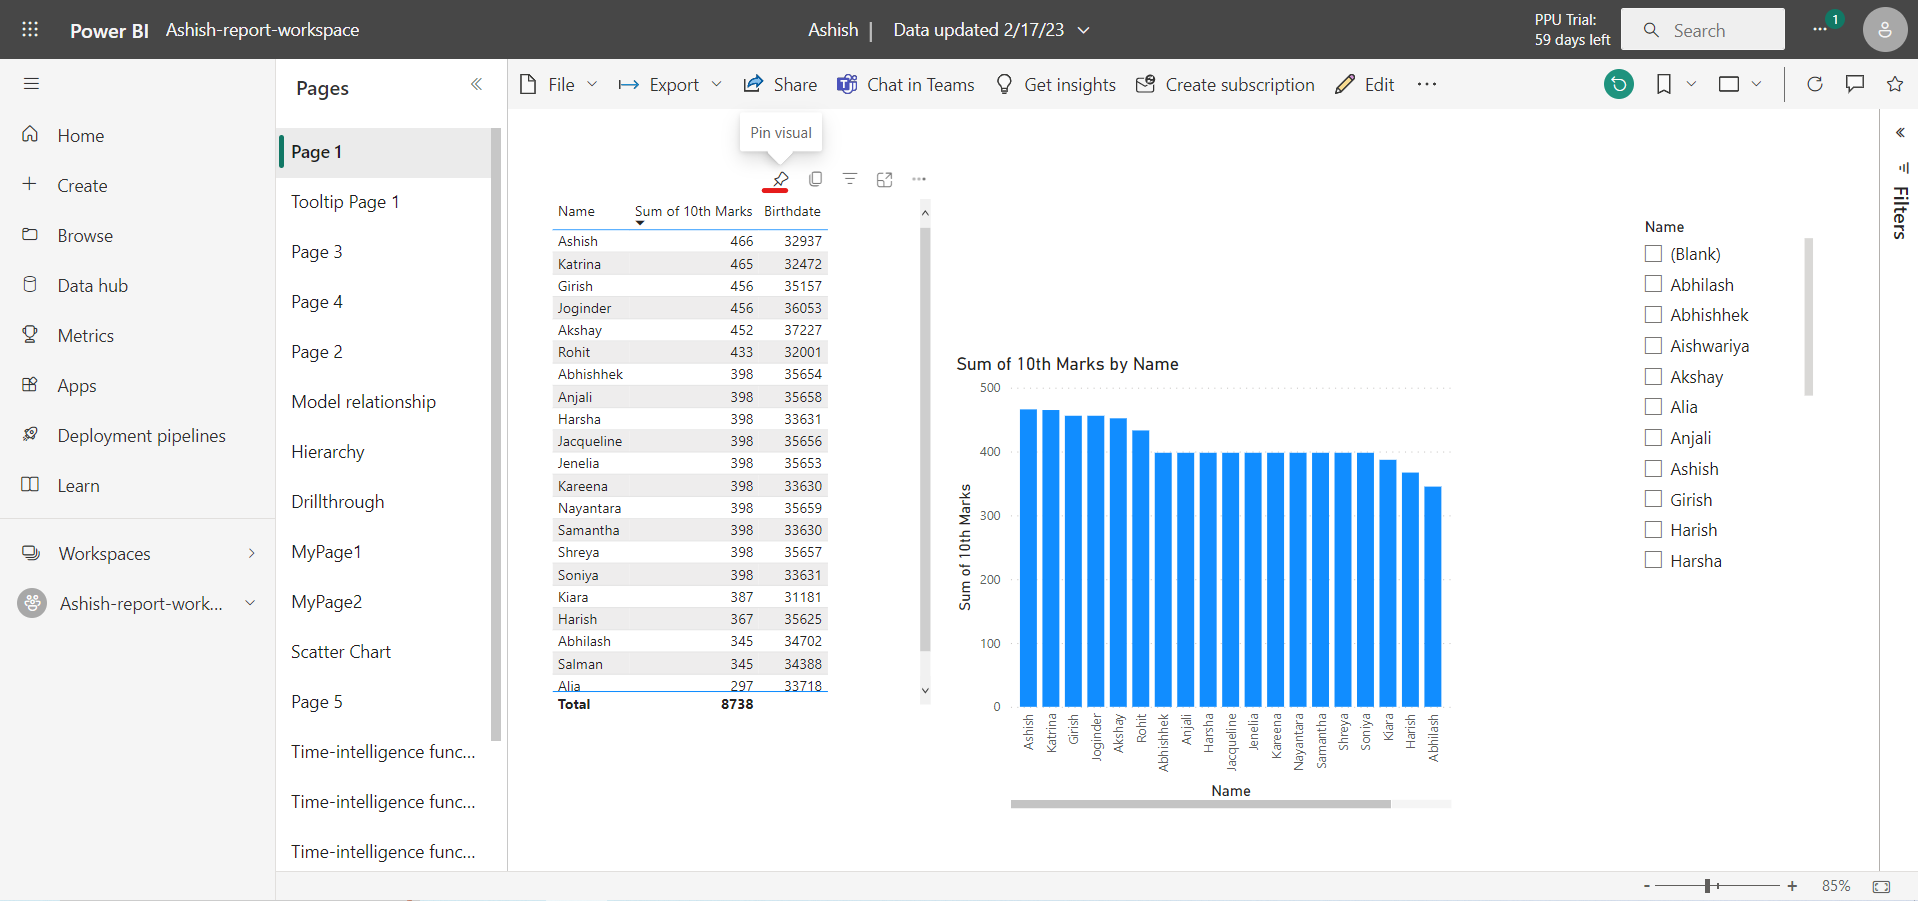
Step 1: Open the Report and by moving the mouse cursor to any visual, we will see Pin Visual icon on the top of the tile.
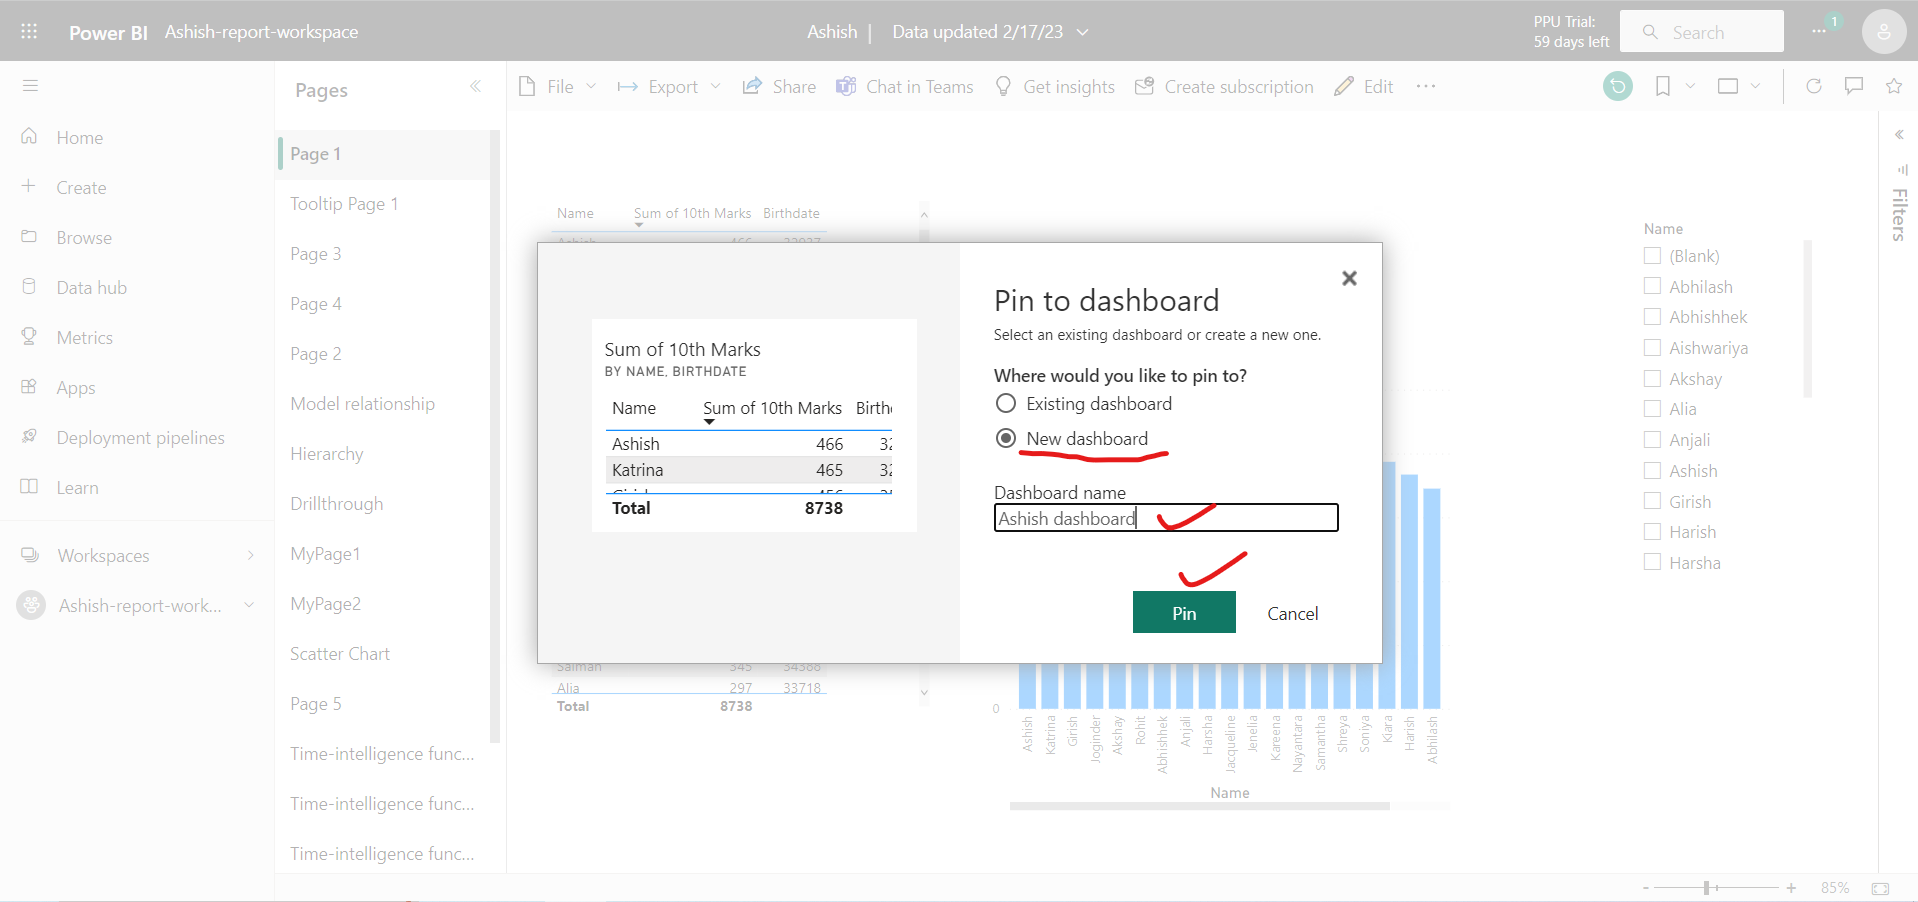
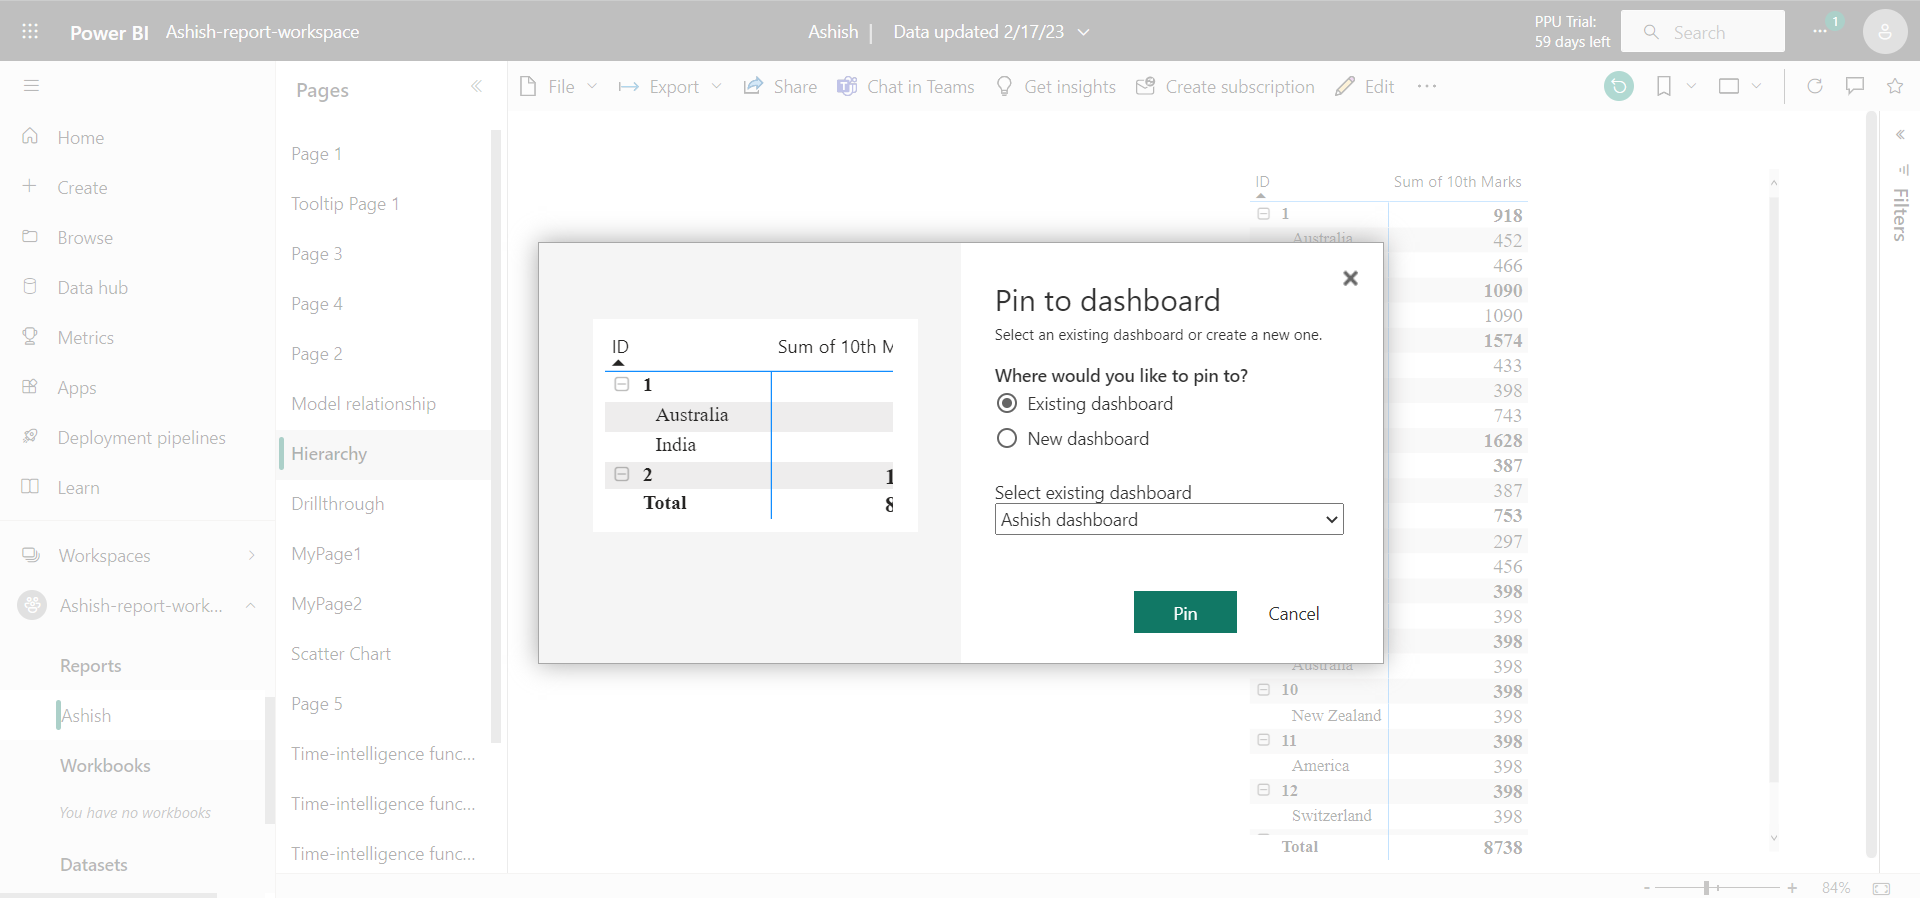
Step 2: After we have selected the icon, a window will appear, where we can choose to pin this visual to a new or existing dashboard.
• Existing dashboard: Select the name of the dashboard from the dropdown. Dashboards that have been shared with us won't appear in the dropdown.
• New dashboard: Enter the name of the new dashboard.
For this example, we want our tile to be on a new dashboard called Ashish dashboard.
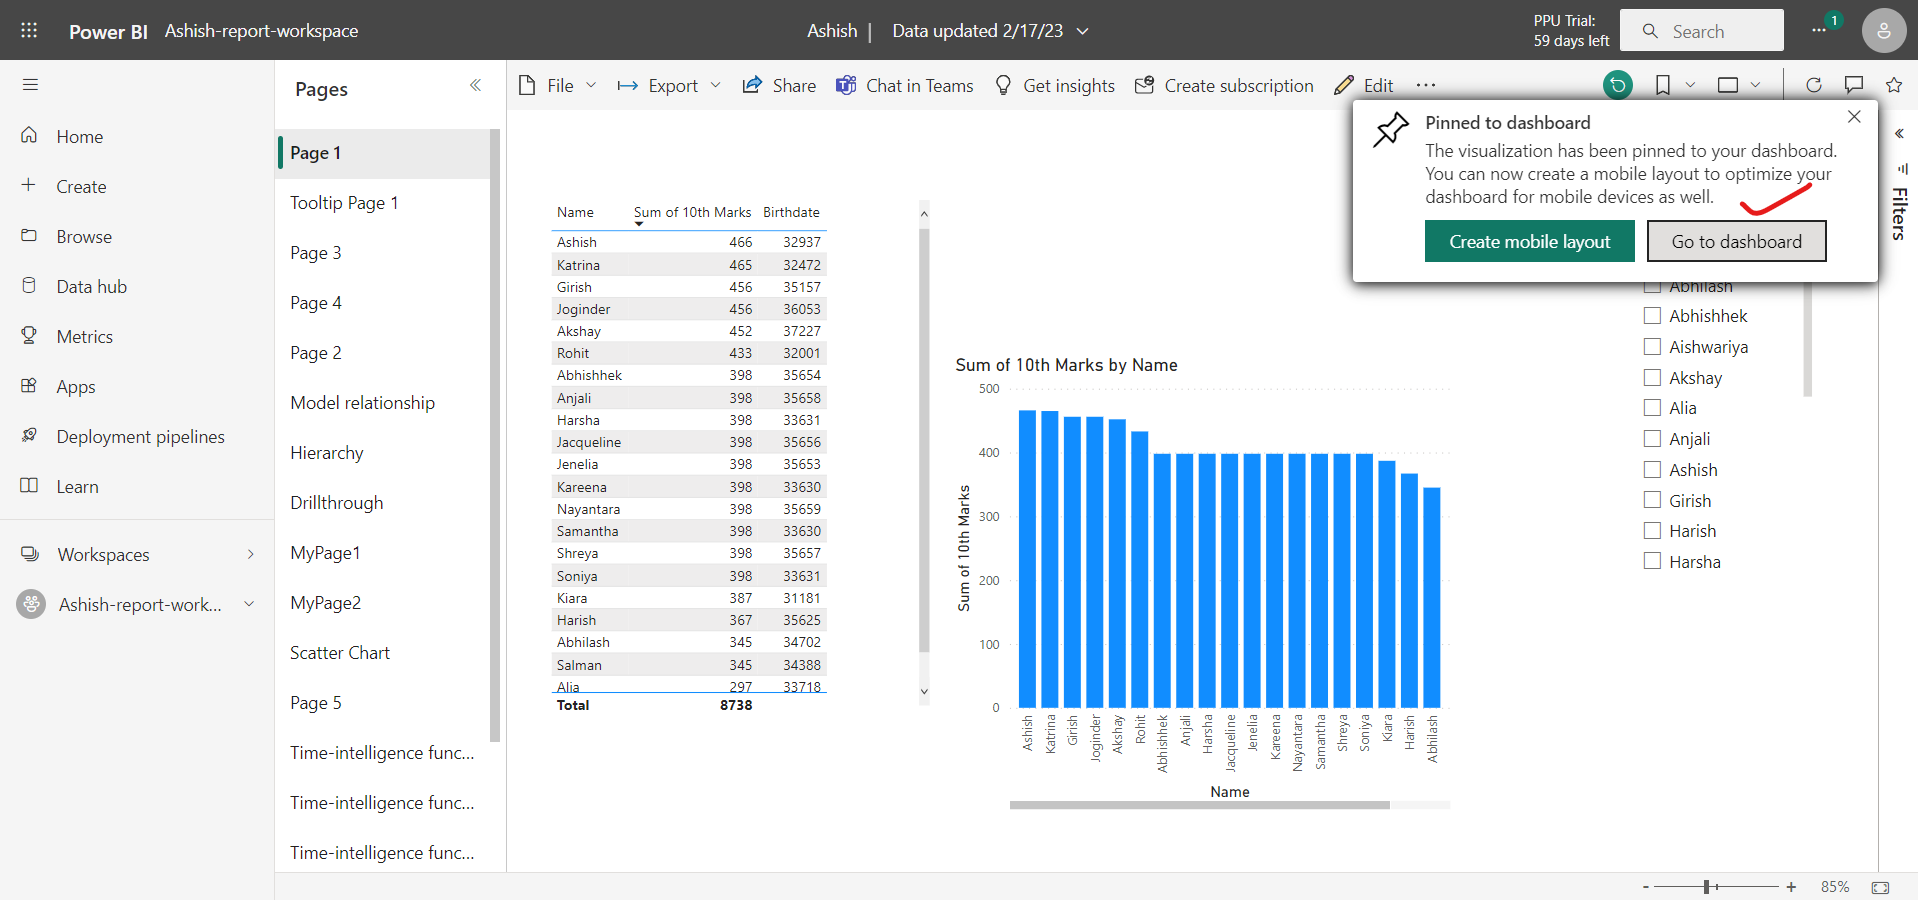
Step 3: After selecting Pin. A message will pop up with the option to Go to Dashboard. Click it.
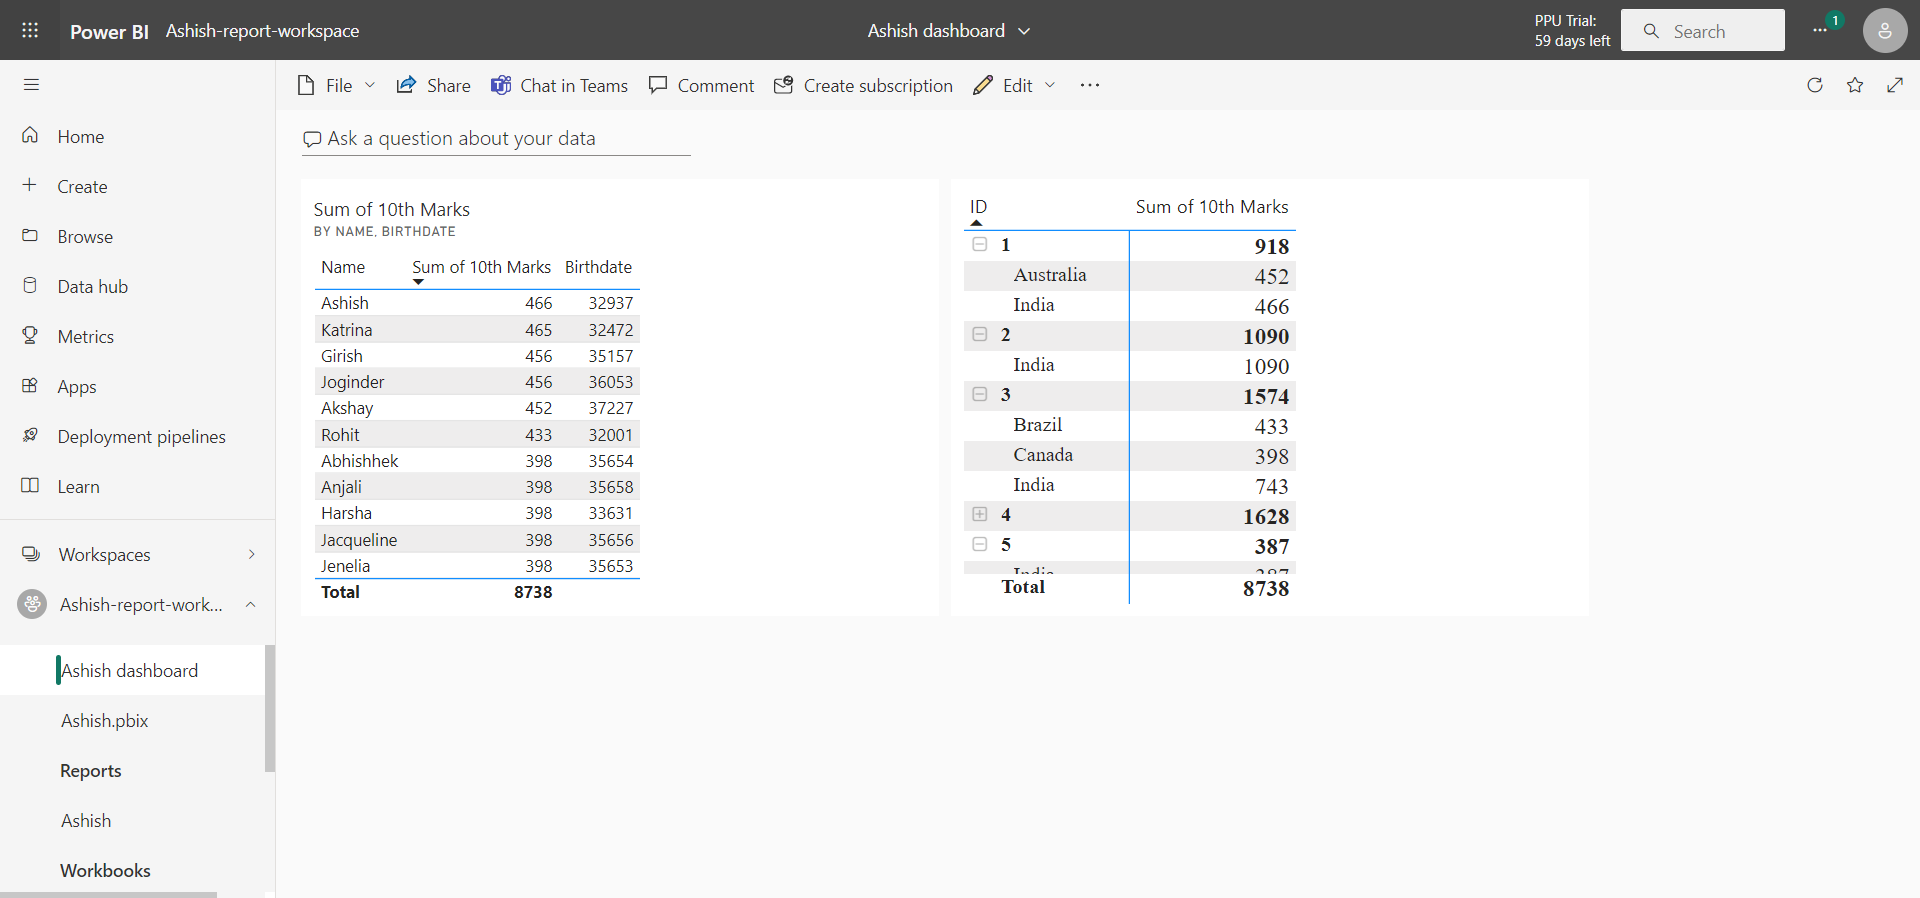
We will be redirected to the new dashboard, where we have just pinned a tile from our report. We can resize and move this visual around the dashboard by selecting the visual, dragging, and then dropping it.
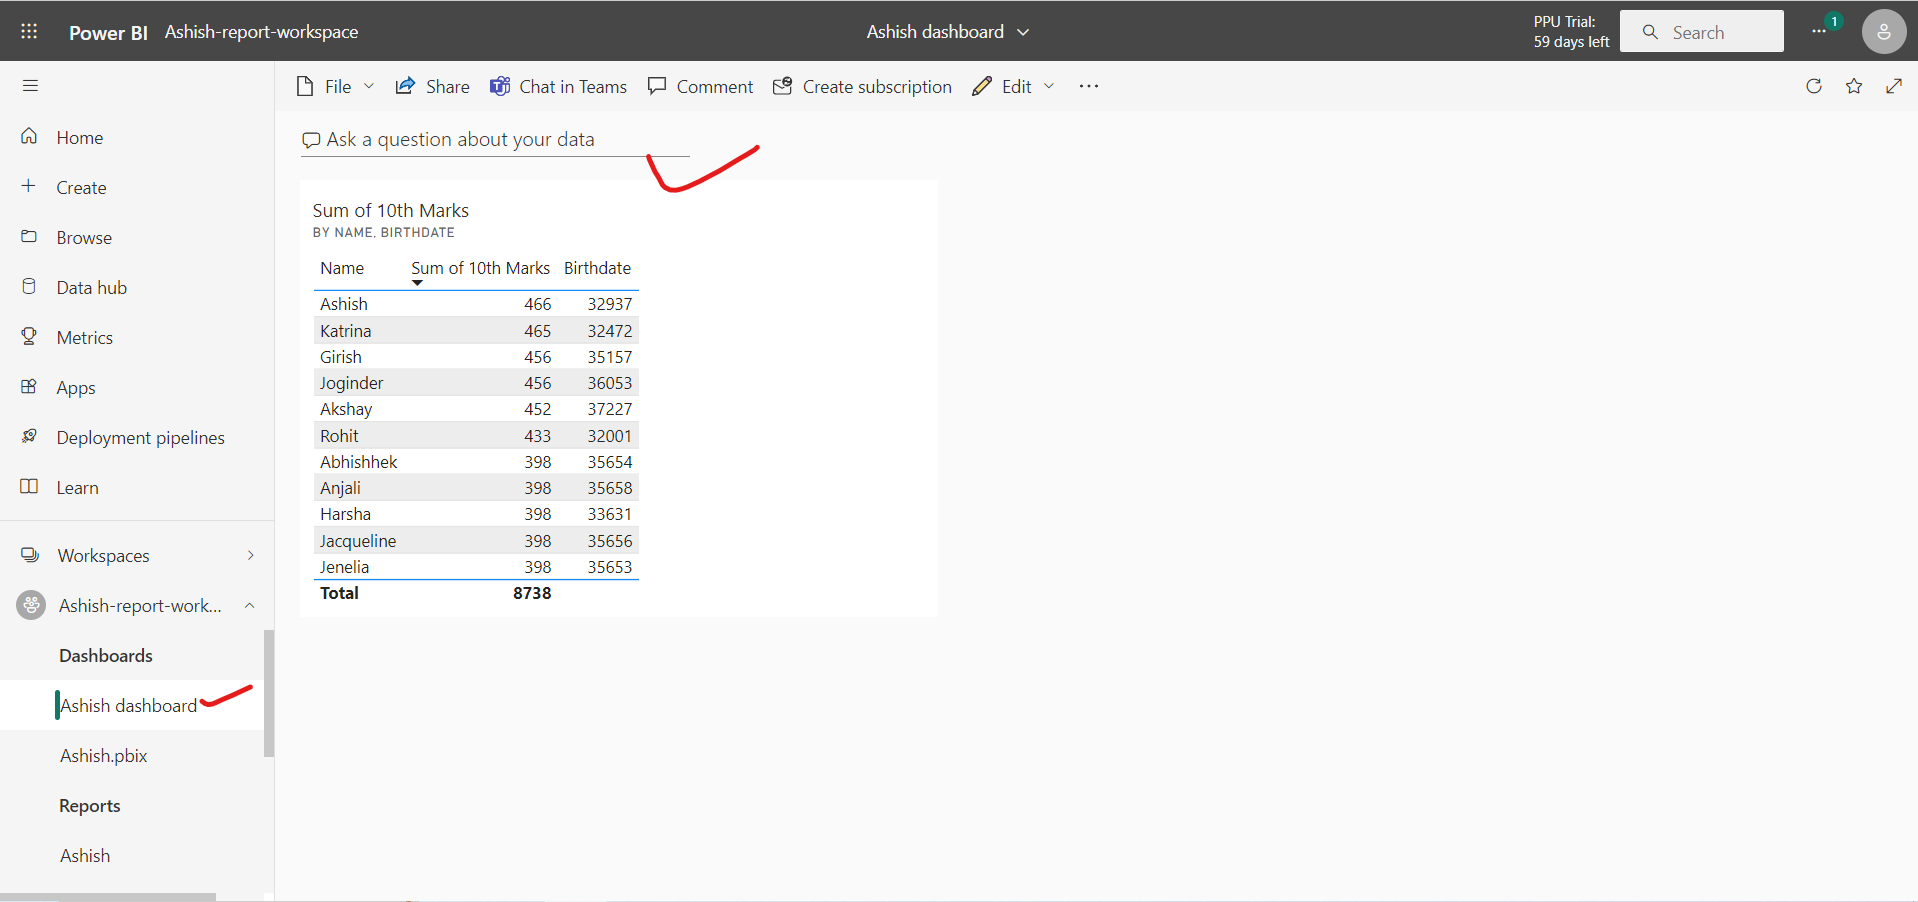
Step 4: We can pin a visual from a different report (and different semantic model) to an existing dashboard. We can perform the same procedure in which we hover over the visual in the original report and then select the Pin icon. The “Pin to dashboard” dialog box will appear, select the dashboard, we want to pin this visual onto and then select Pin.
When we navigate to the dashboard, notice that both visuals are now pinned, regardless of the underlying semantic model.
