Transpose a table
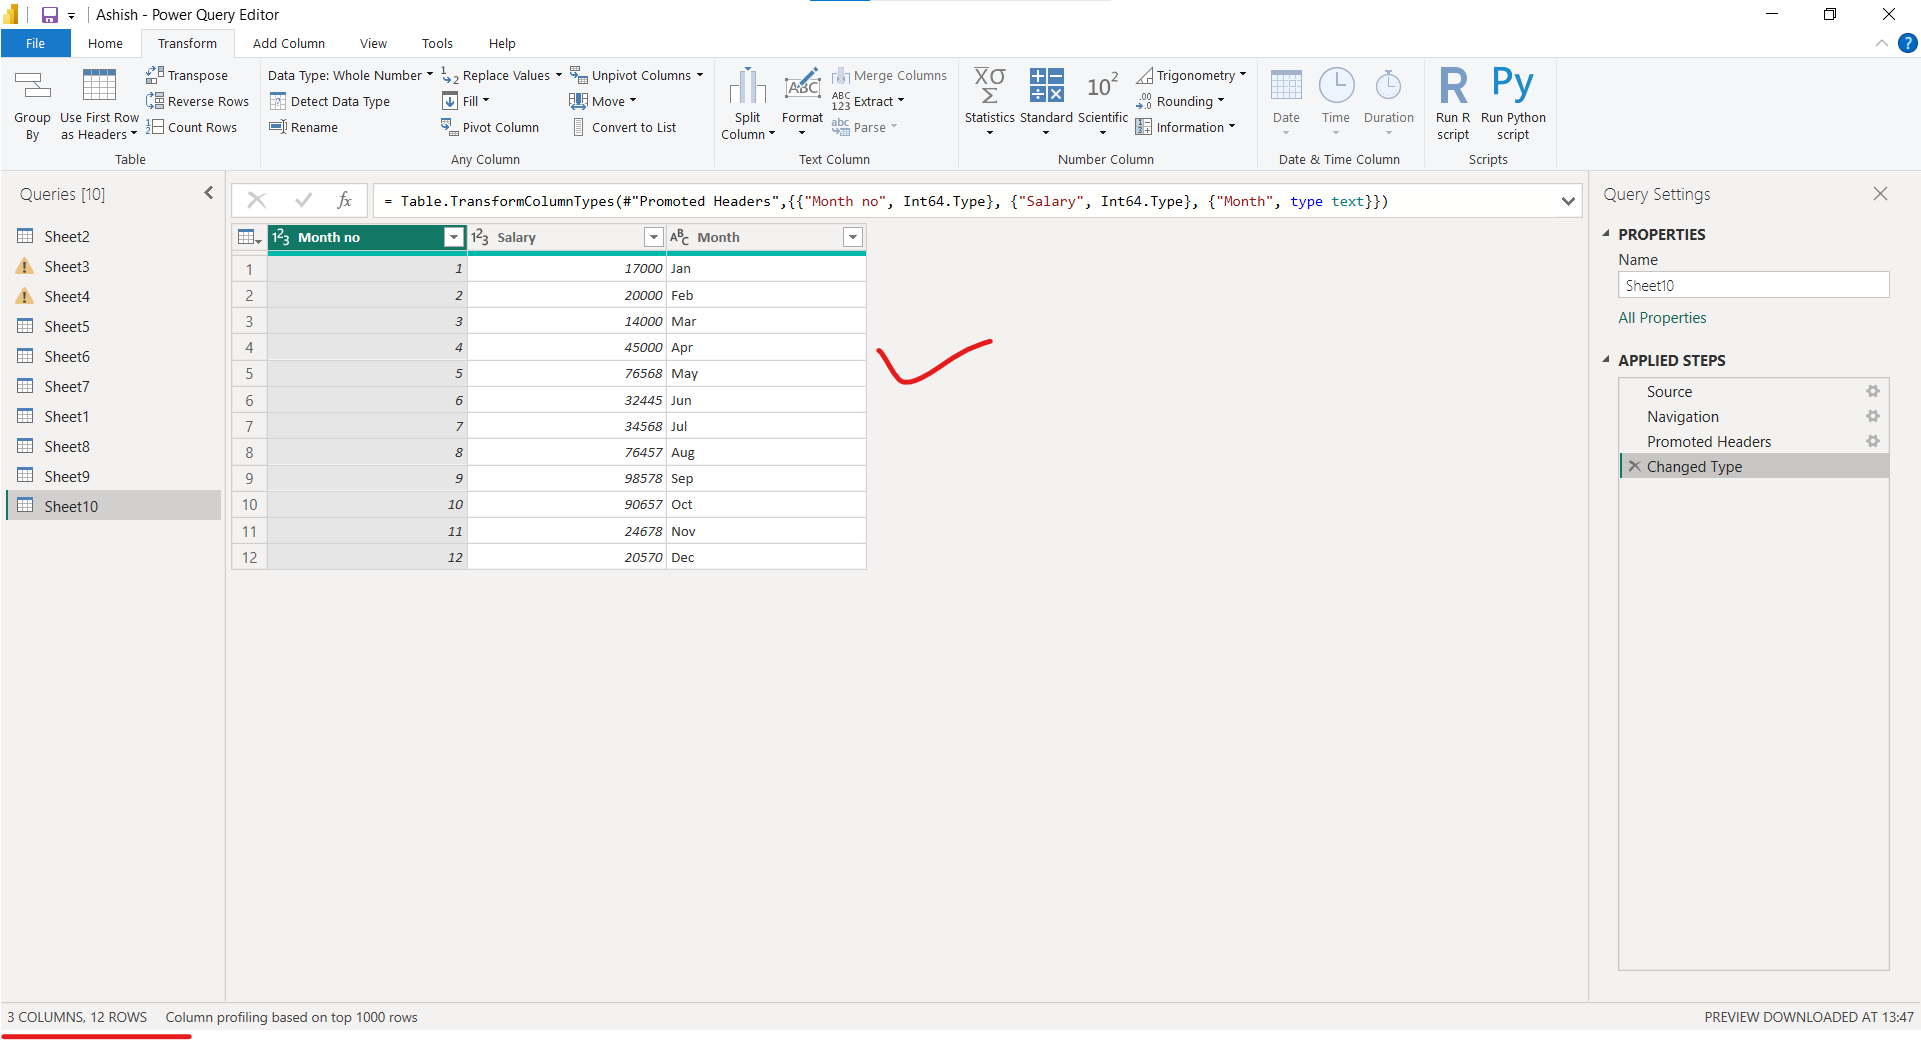
The transpose table operation in Power Query rotates our table 90 degrees, turning our rows into columns and our columns into rows. Imagine a table like the one in the following image, with 12 rows and 3 columns.
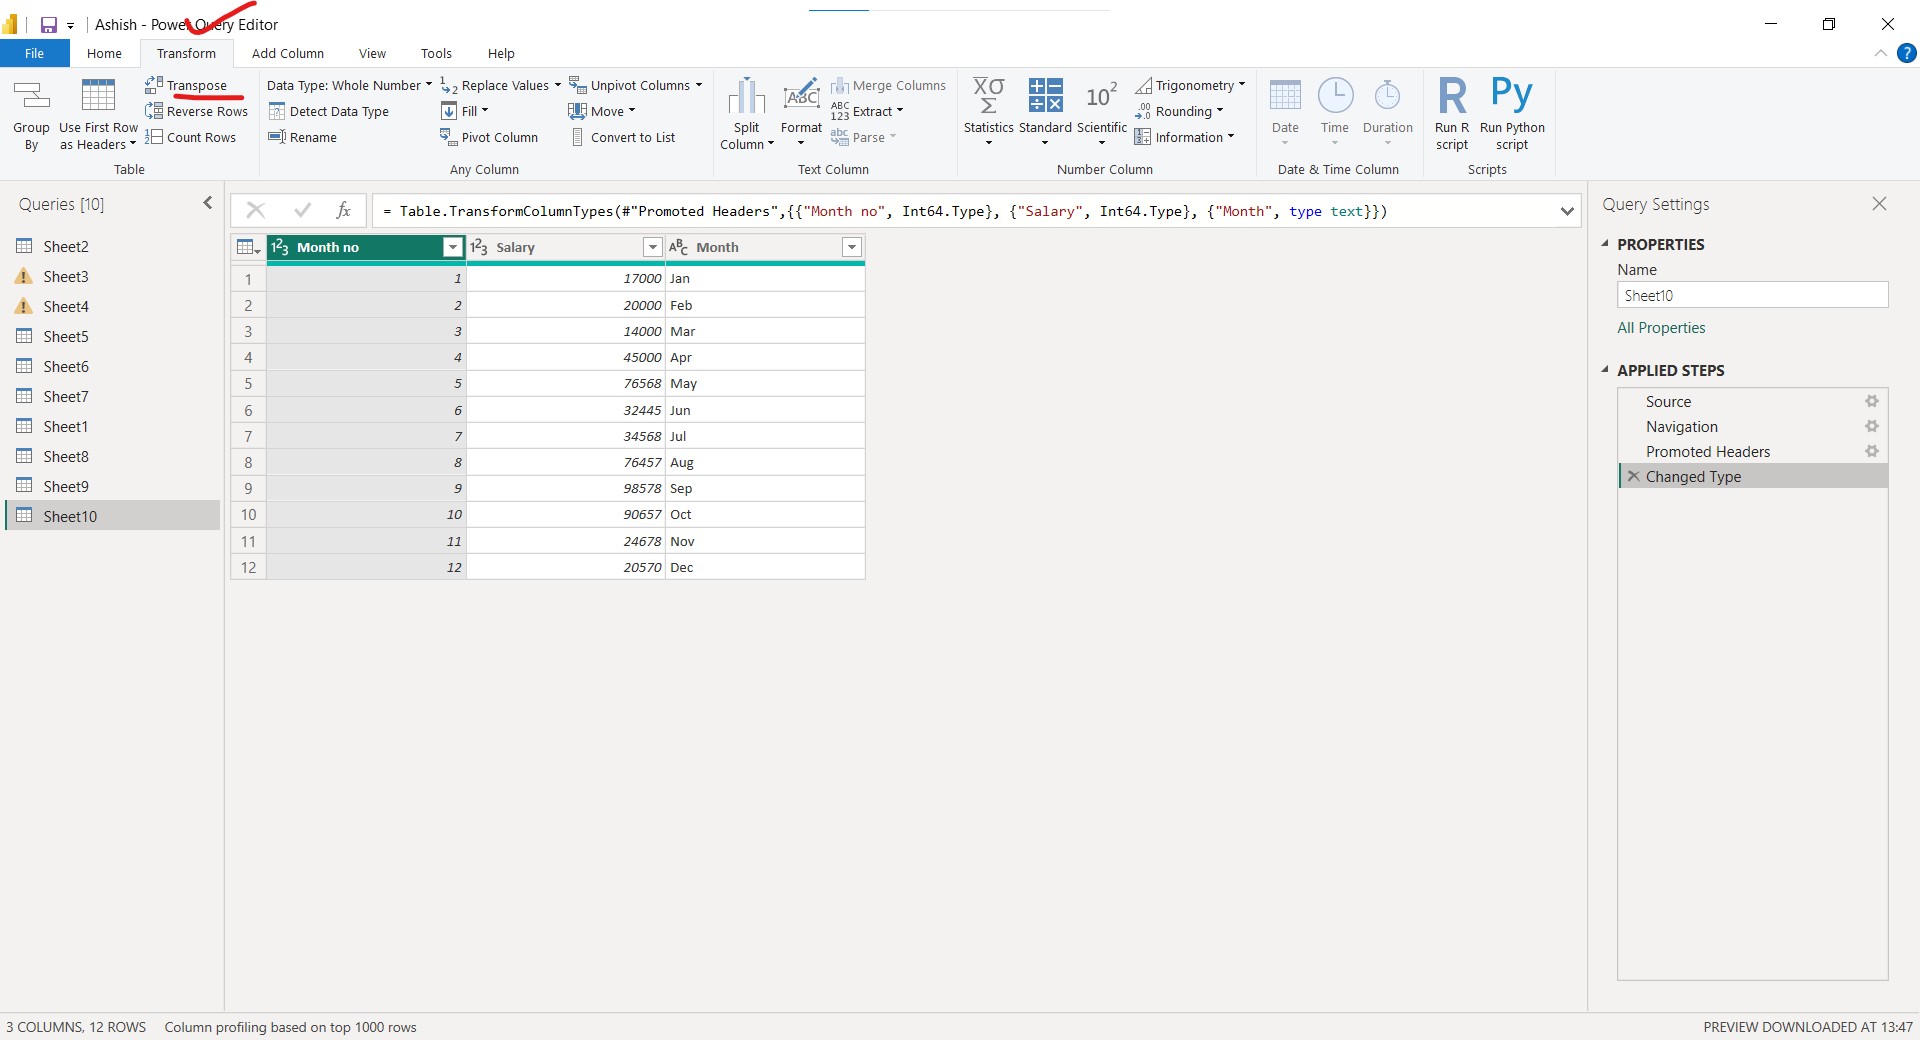
On the Transform tab in the ribbon, select Transpose .
The result of that operation will look like the following image. Now, the table has 3 rows and 12 columns.
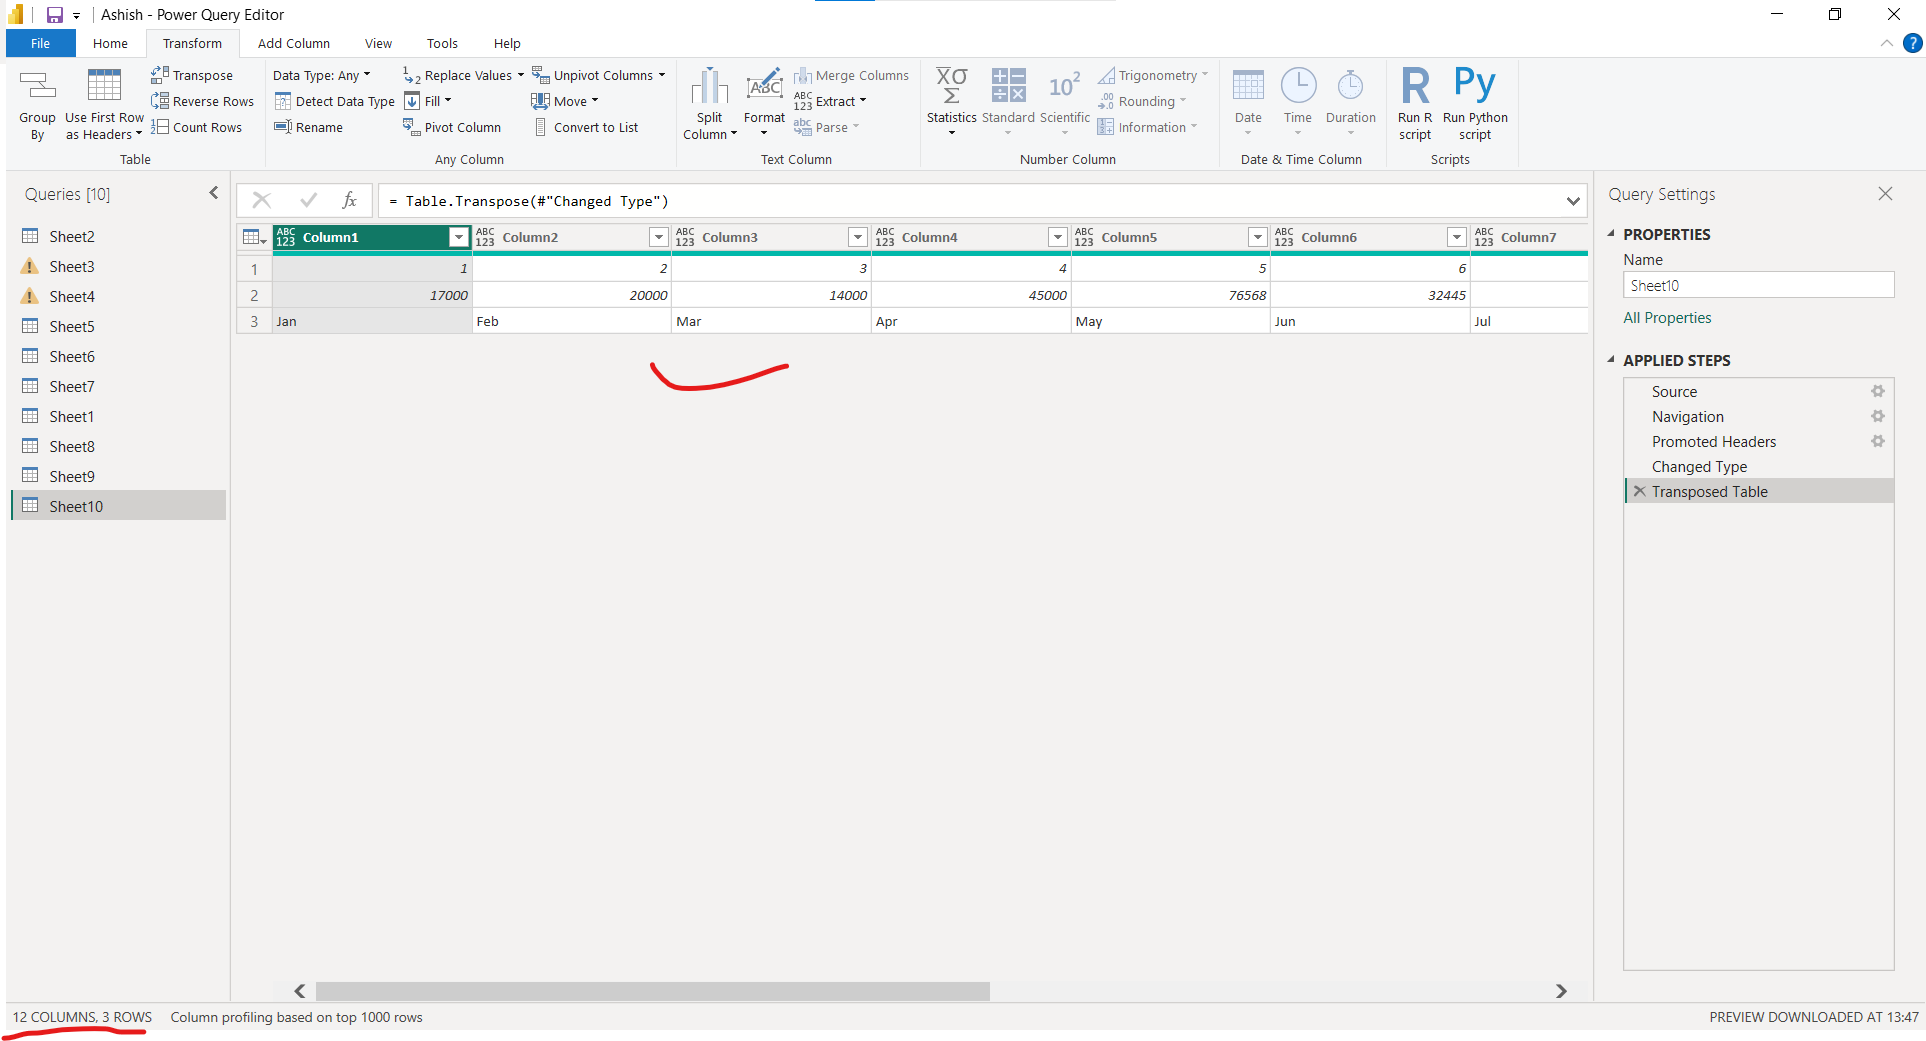
Note: We can note one thing that only the contents of the table will be transposed during the transpose operation; the column headers of the initial table will be lost. The new columns will have the name Column followed by a sequential number.
If we want to use the first row of the table as the headers, select the table icon in the upper-left corner of the data preview, and then select Use first row as headers.
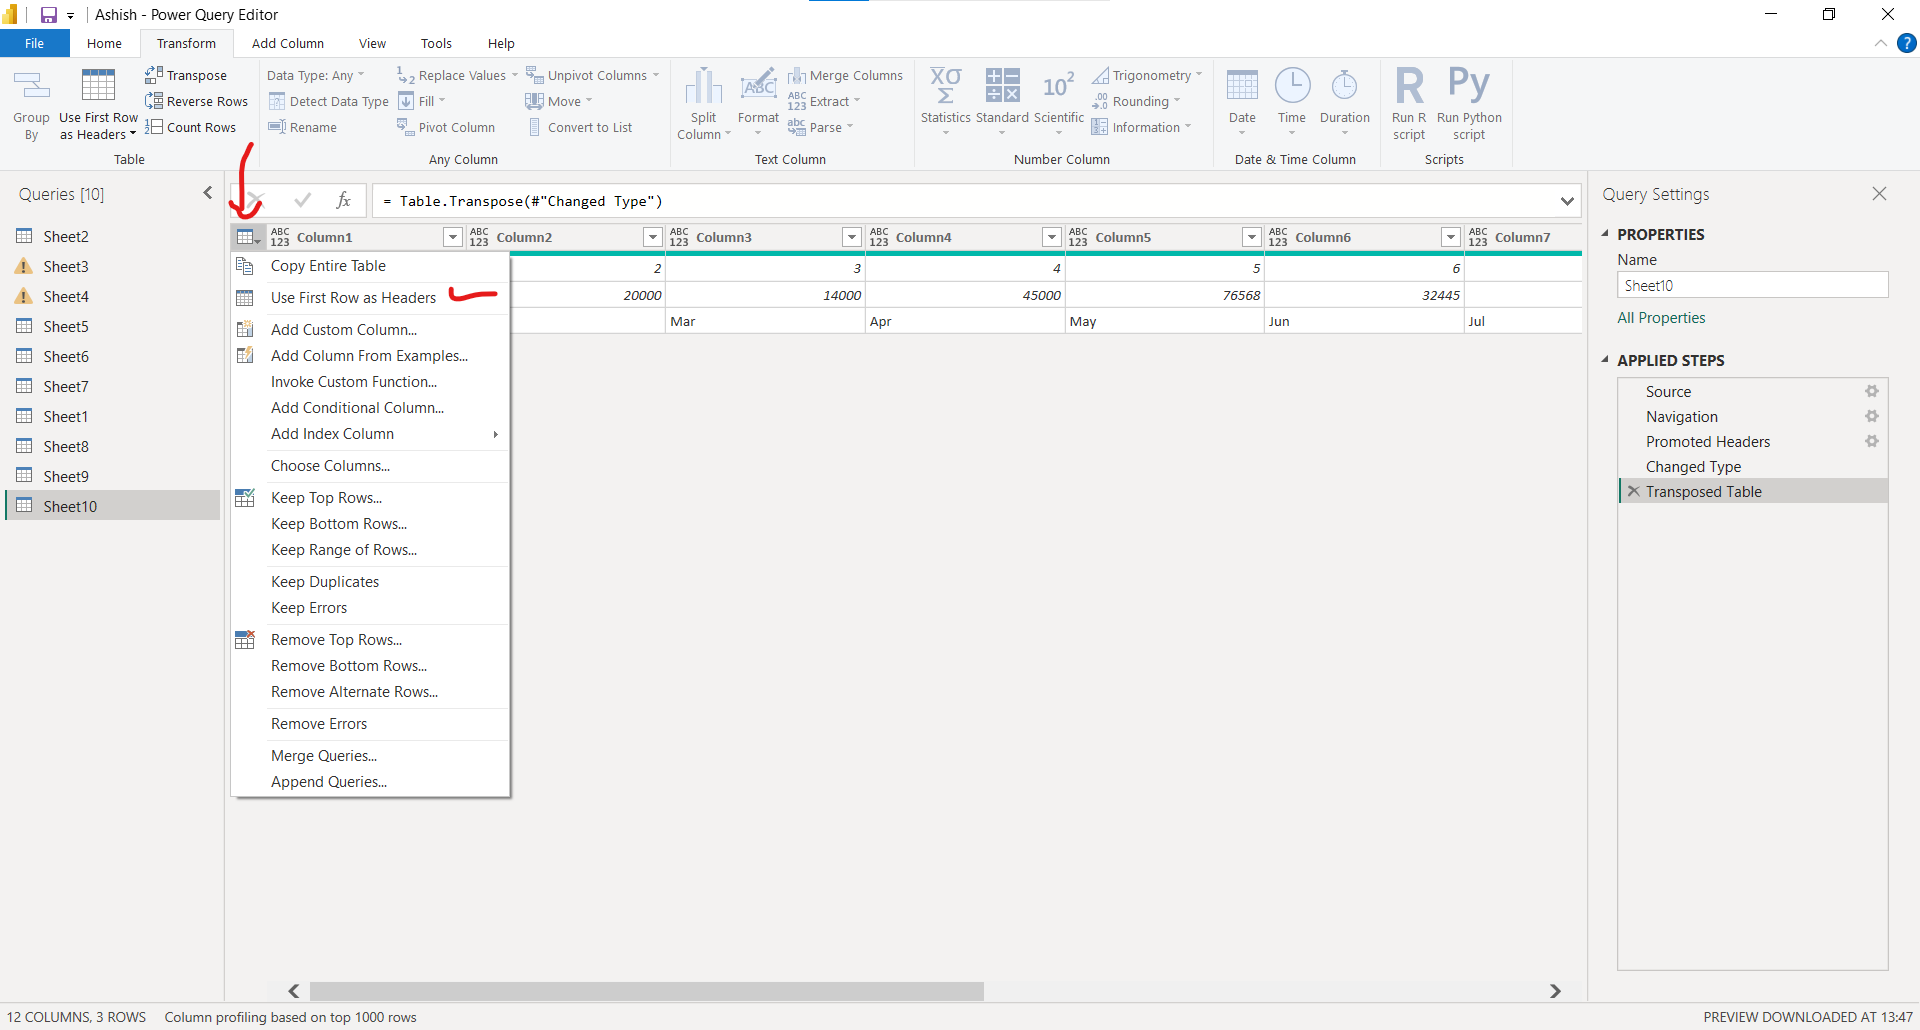
The result of that operation will give us the following output:
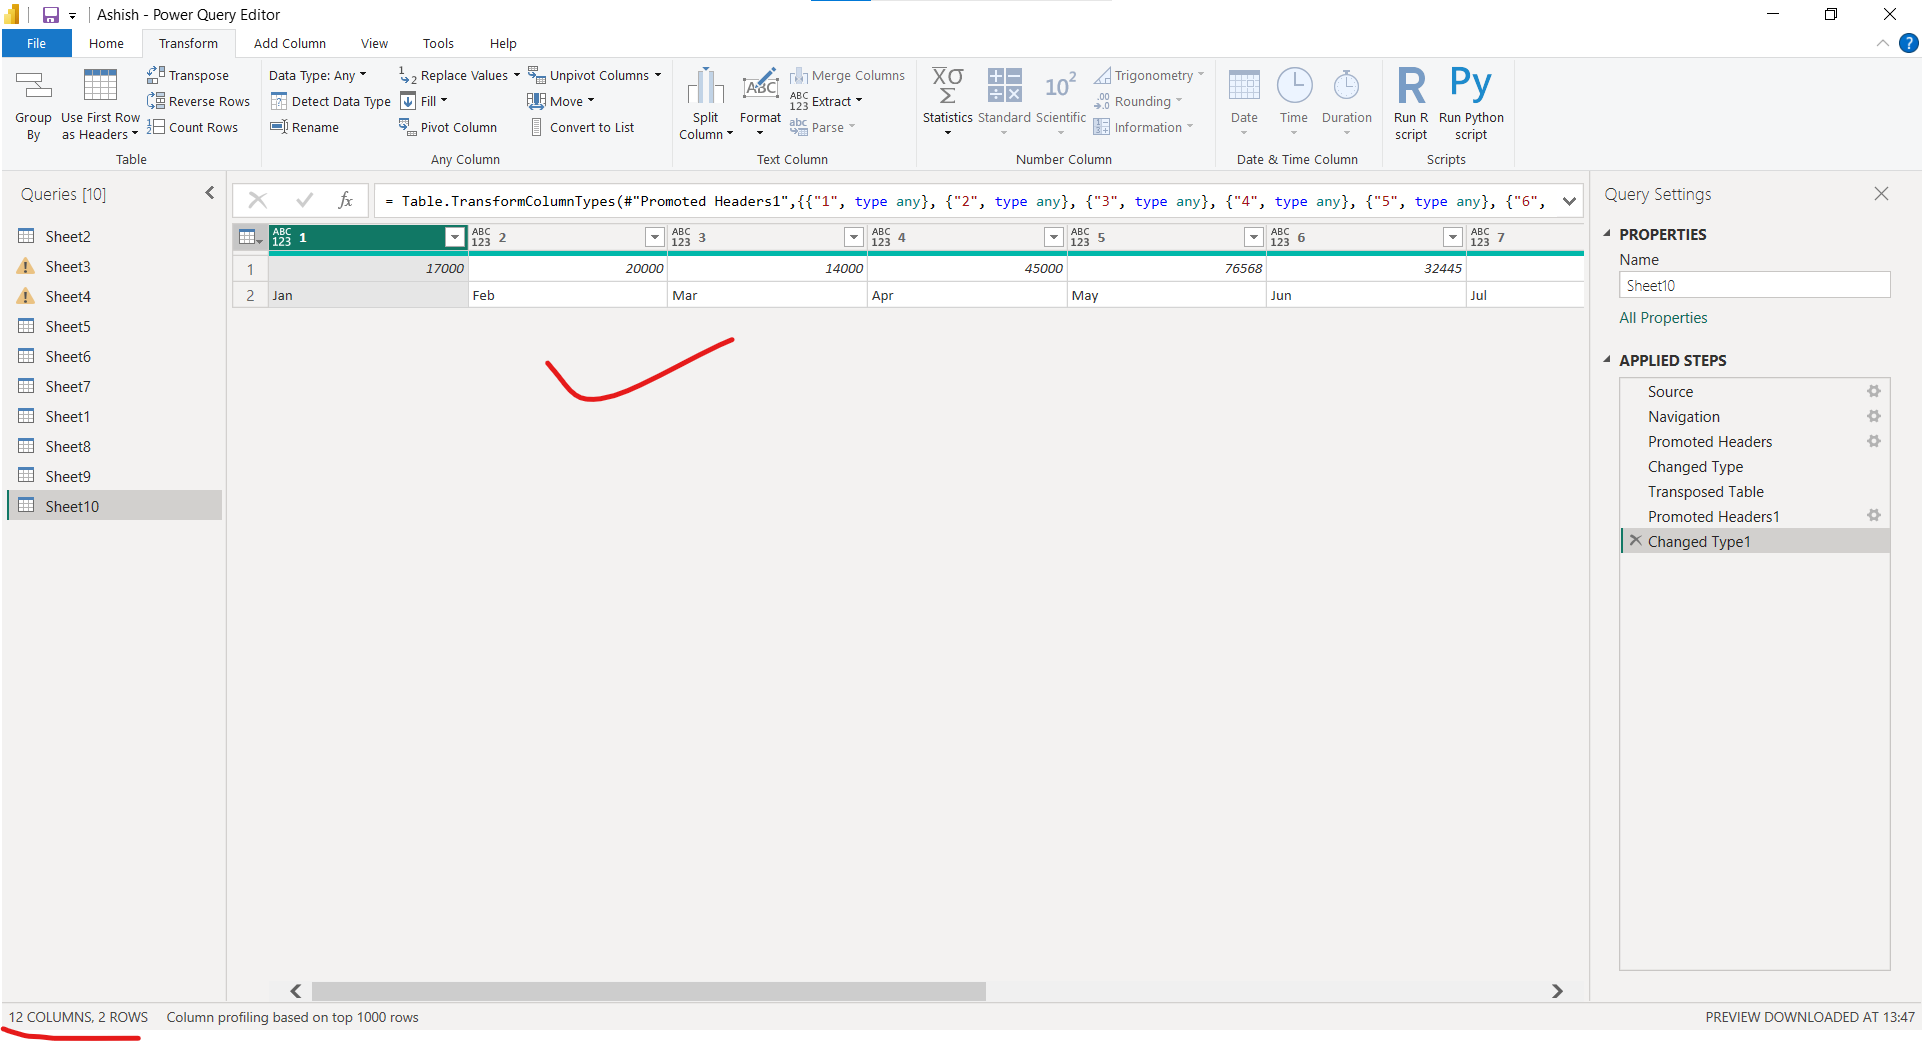
So, in the final table we have 12 columns and two rows.