List Slicer visual in Power BI
List slicer is a new slicer visual in the Power BI. Basically, the list slicer is same as the normal slicer with Vertical list type. But on top of that in list slicer we have a lot of customization options available which are going to see in this exercise.
Let’ add a list slicer visualization and format it in the Power BI.
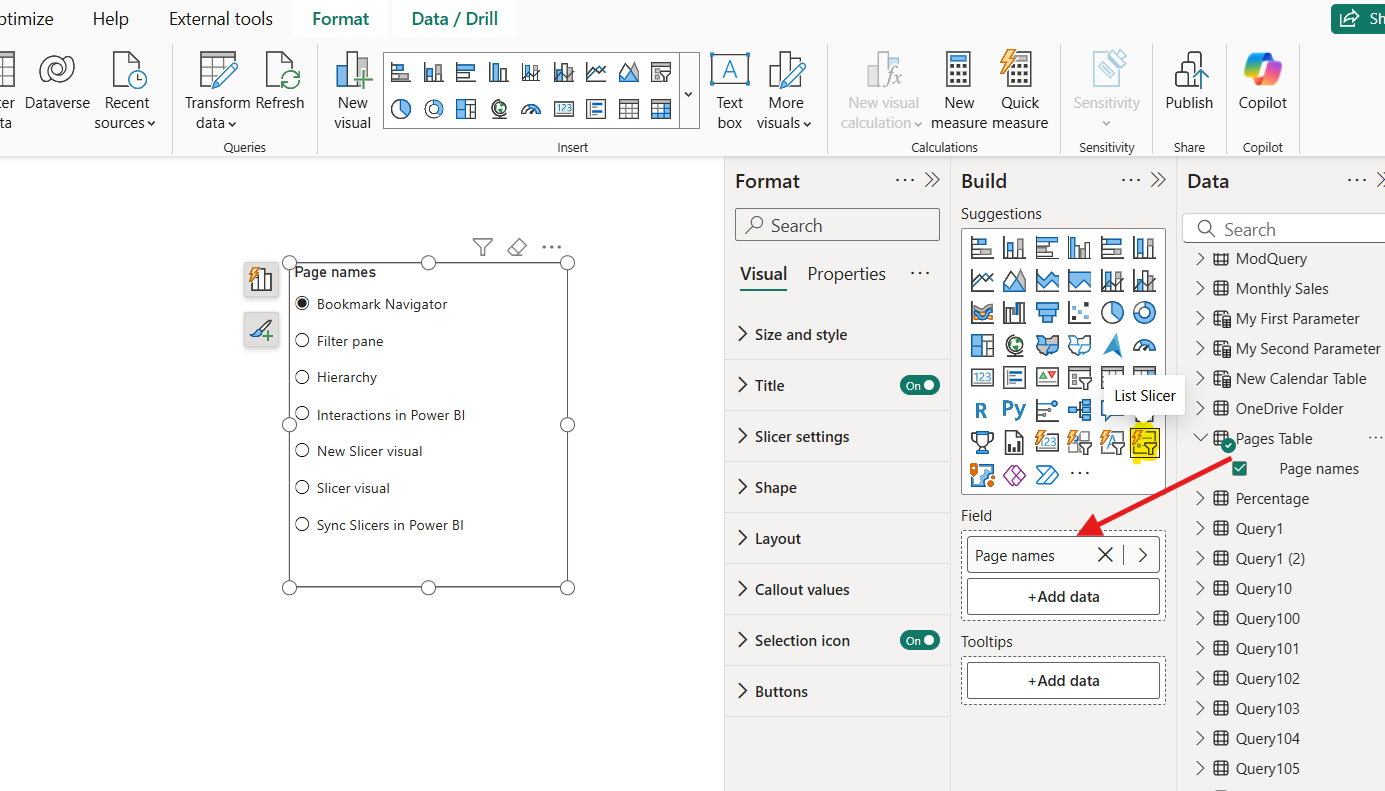
Step 1: To add a list slicer from the Build pane, click on List Slicer.
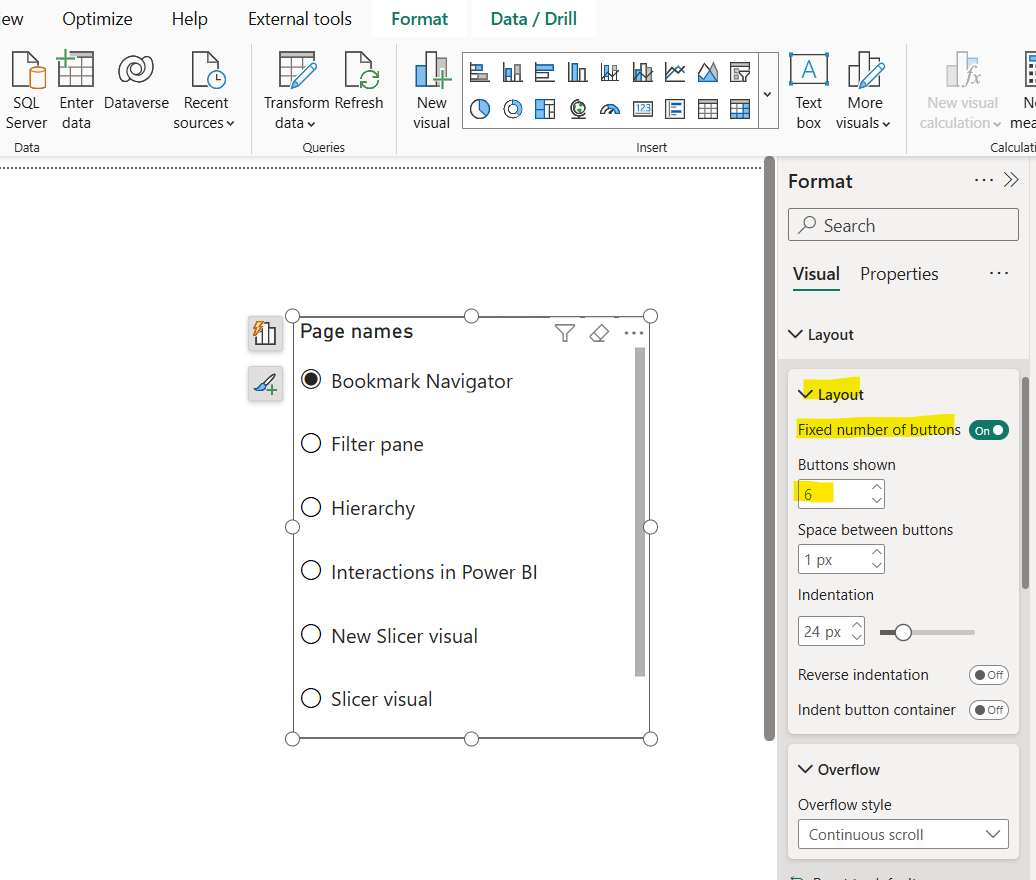
Step 2: From the Layout section we can choose the number of buttons to be shown without scroll, space between the buttons and the indentation.
When we turn off the Fixed number of buttons toggle then all the values are trying to fit within the same height and width of the slicer, which makes difficult to select the values.
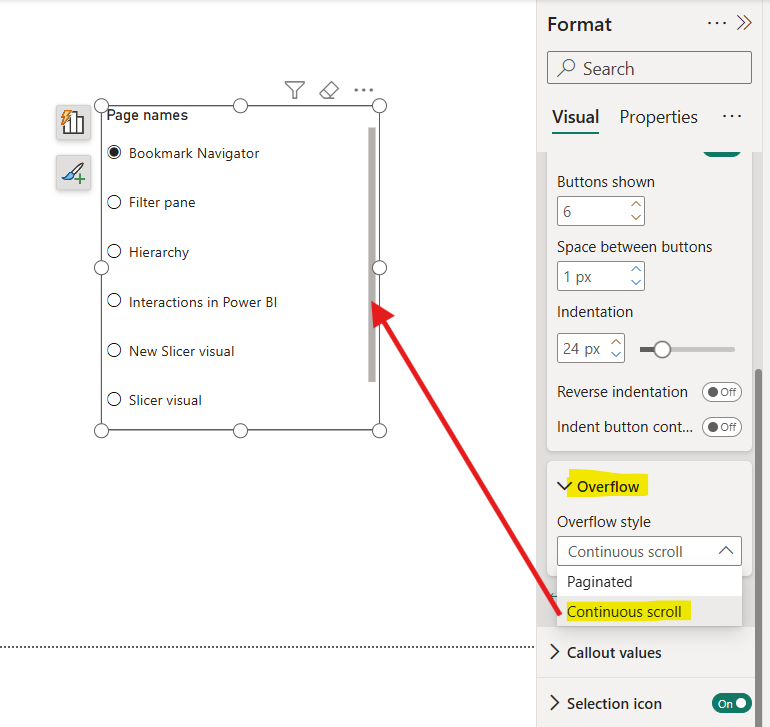
Step 3: From the Overflow styling, we can choose the Overflow style, that how the slicer handles overflow content (e.g., Continuous scroll, paginated).
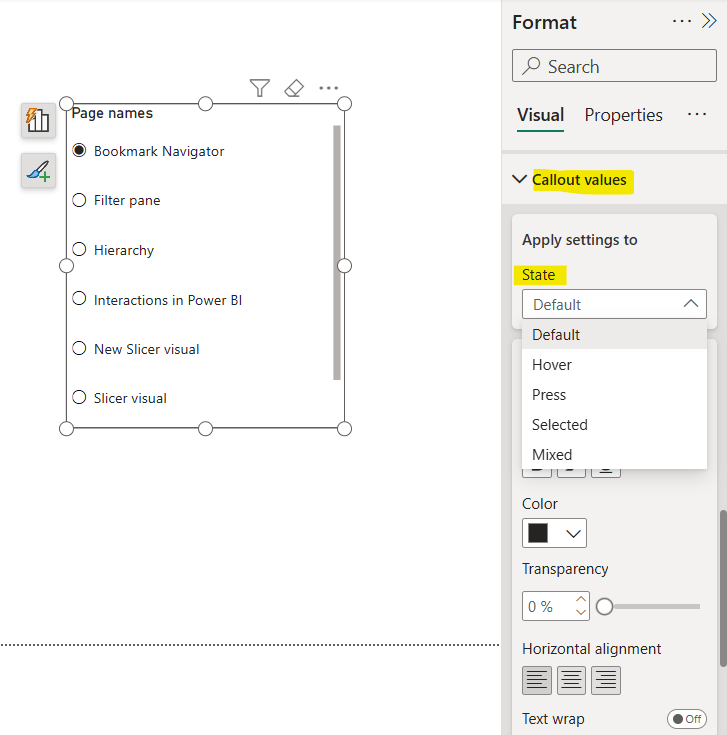
Step 4: In the Callout values section we can specify the different formatting based on the interaction state.
We have the following states in the list slicer:
• Default
• Hover
• Press
• Selected
• Mixed
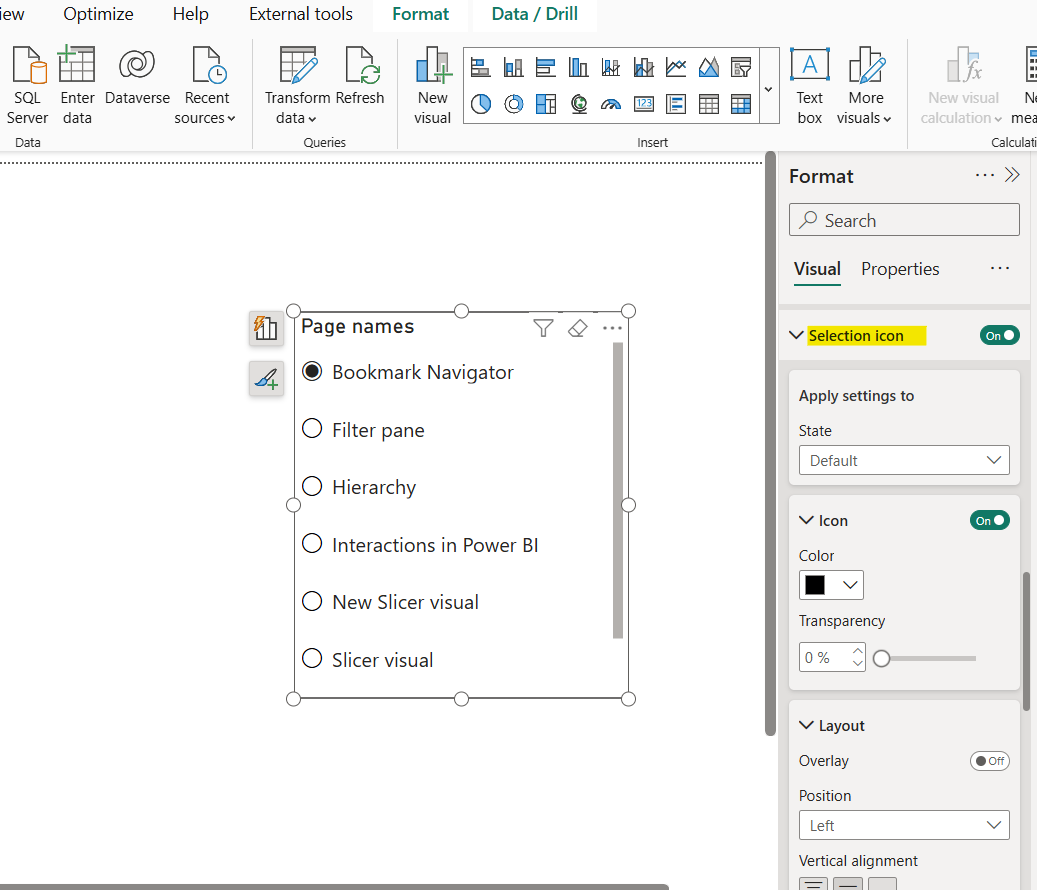
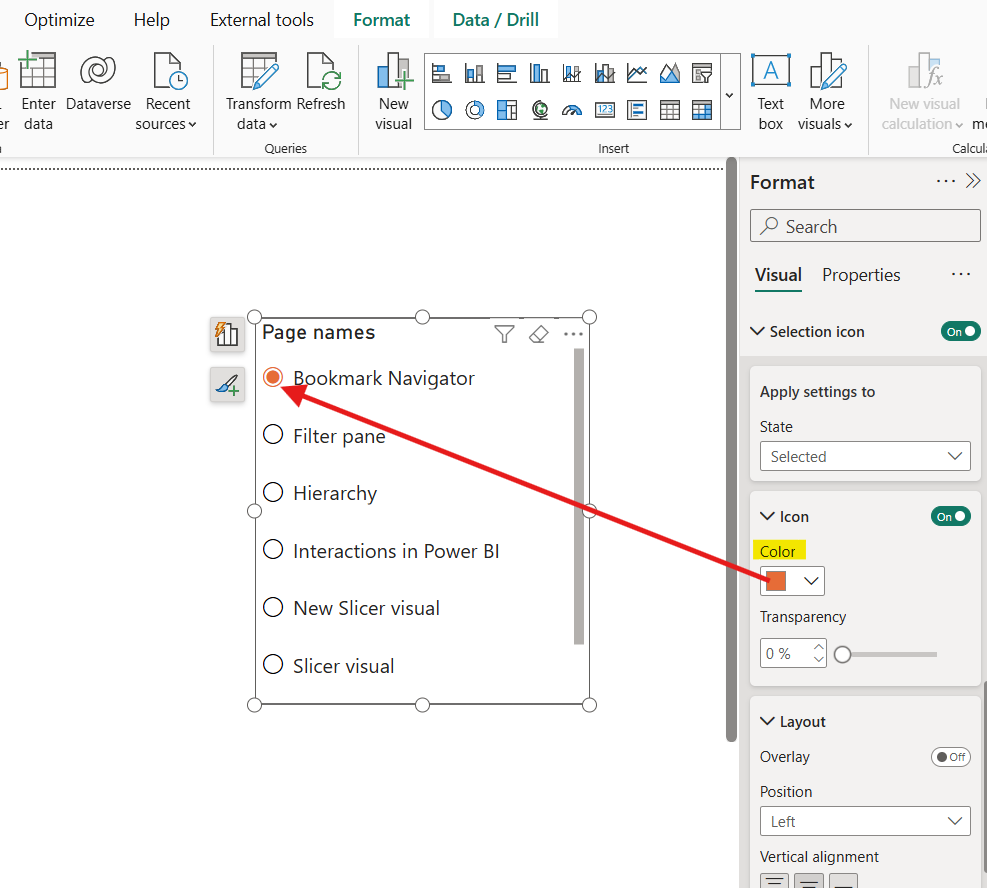
Step 5: We can specify the Selection icon. We can specify its color and position based on the different interaction state of the slicer.
For example, we have selected the orange color for icon at the selected state of the slicer.
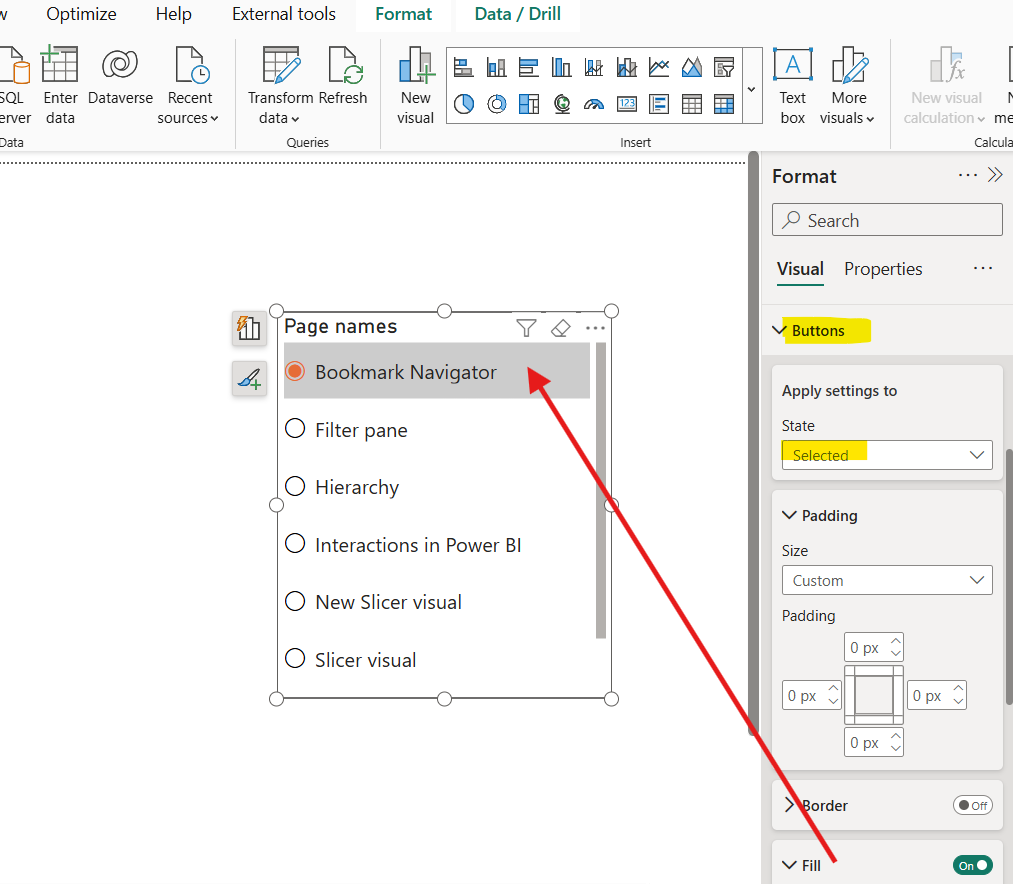
Step 6: Go to the Buttons section to customize the appearance of buttons within the slicer.
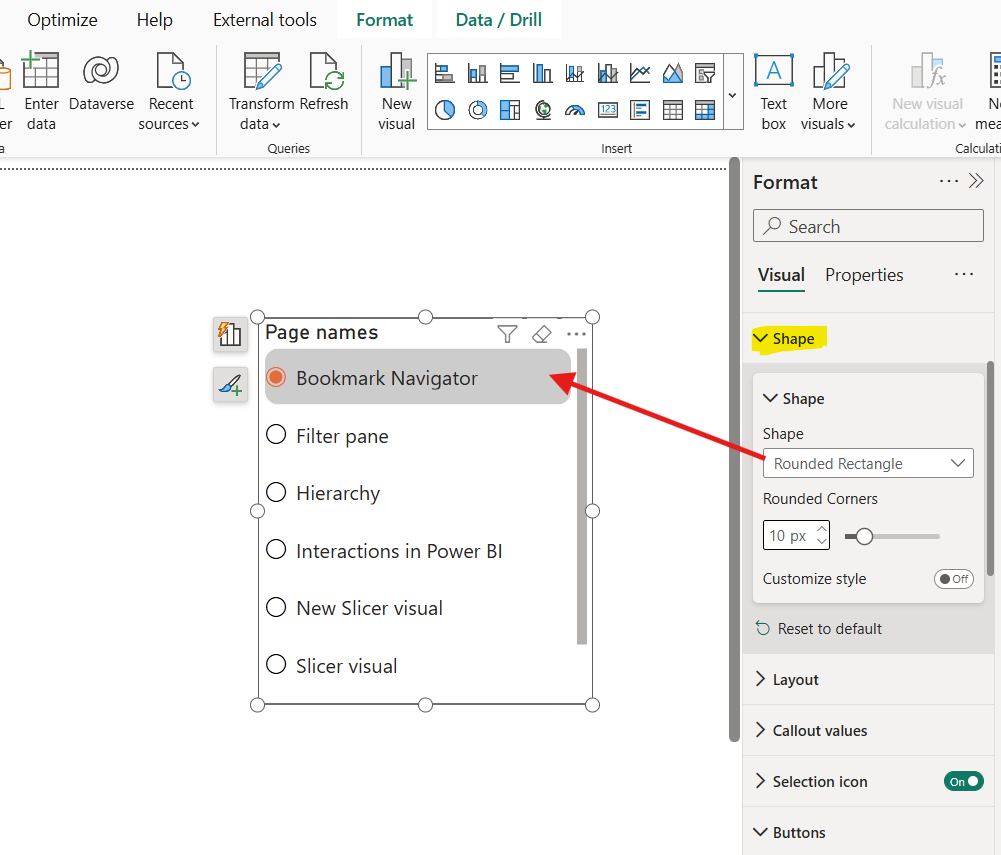
Step 7: From the Shapes section we can choose the shape that we want to assign to the button and customize it.
Step 8: When we add the multiple fields, so the slicer acts as a hierarchical slicer then the section Expand/Collapse icon are going to be available to customize the slicer. We can change the color and layout of the icon for hierarchy.
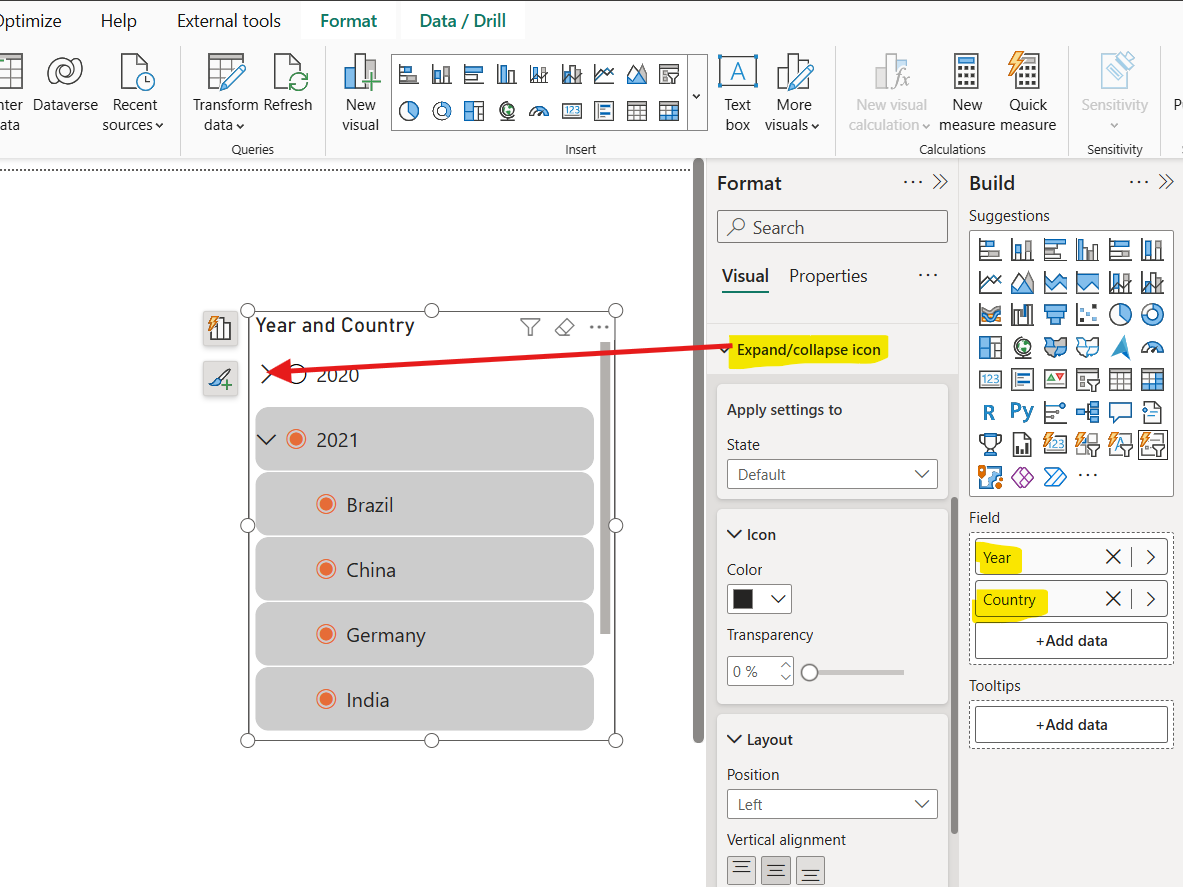
We can customize it based on different interaction state of the slicer.