Numeric range parameters in Power BI
We can create variables for our reports, interact with the variable as a slicer, and visualize and quantify different key values in our reports.
Step 1: To create a parameter, select “New parameter” from the Modeling tab in Power BI Desktop, and choose Numeric range.
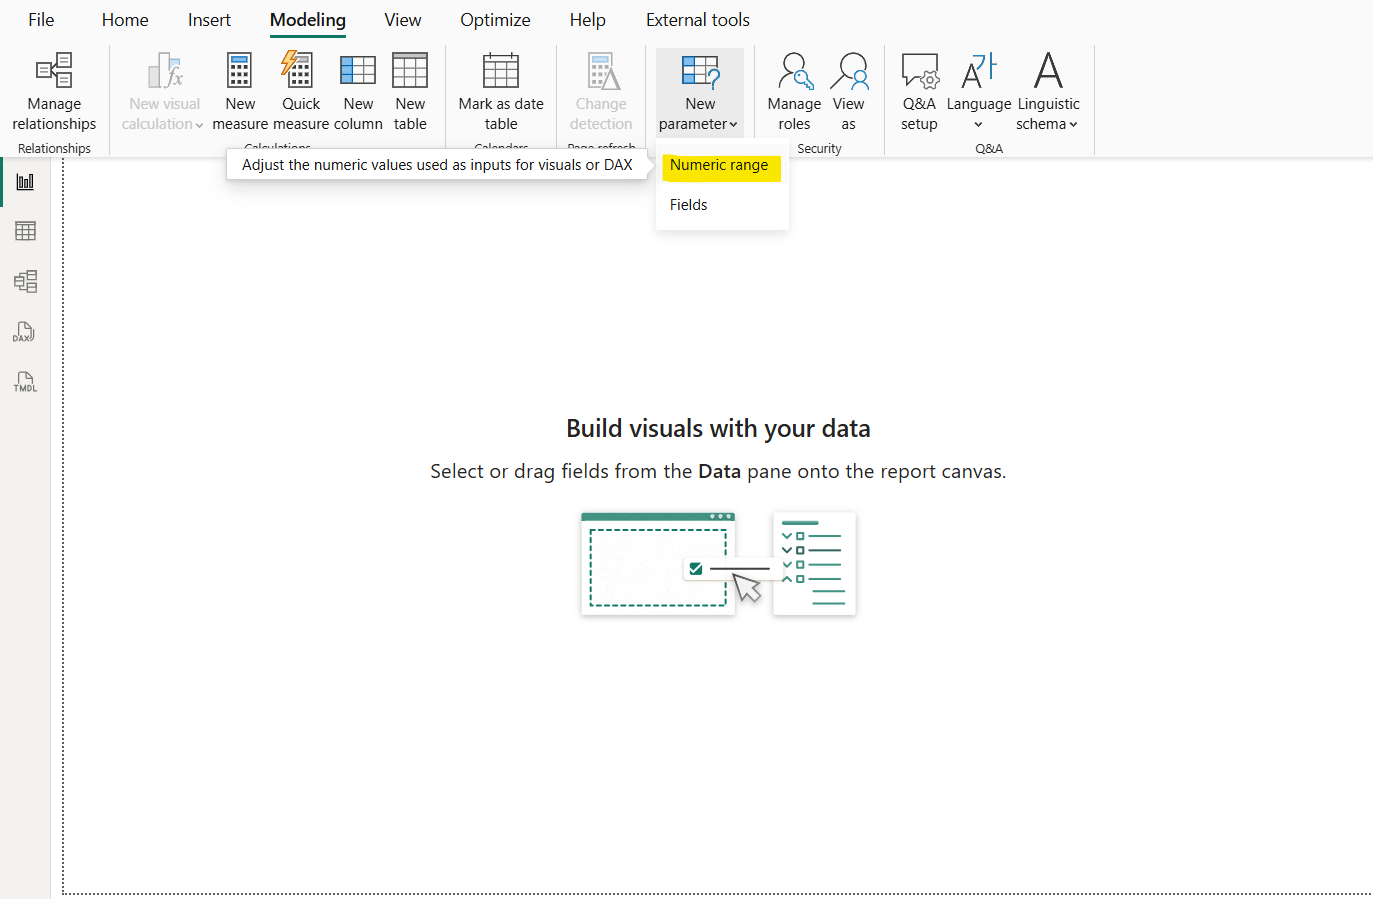
When we select it, a dialog box appears where we can configure the parameter.
The following examples use Numeric range, Name it as Marks Parameter and set its Data type to Whole number. The Minimum value is zero. The Maximum is 500. Also set the Increment to 5. The increment determines how much the parameter will adjust when interacted with in a report.
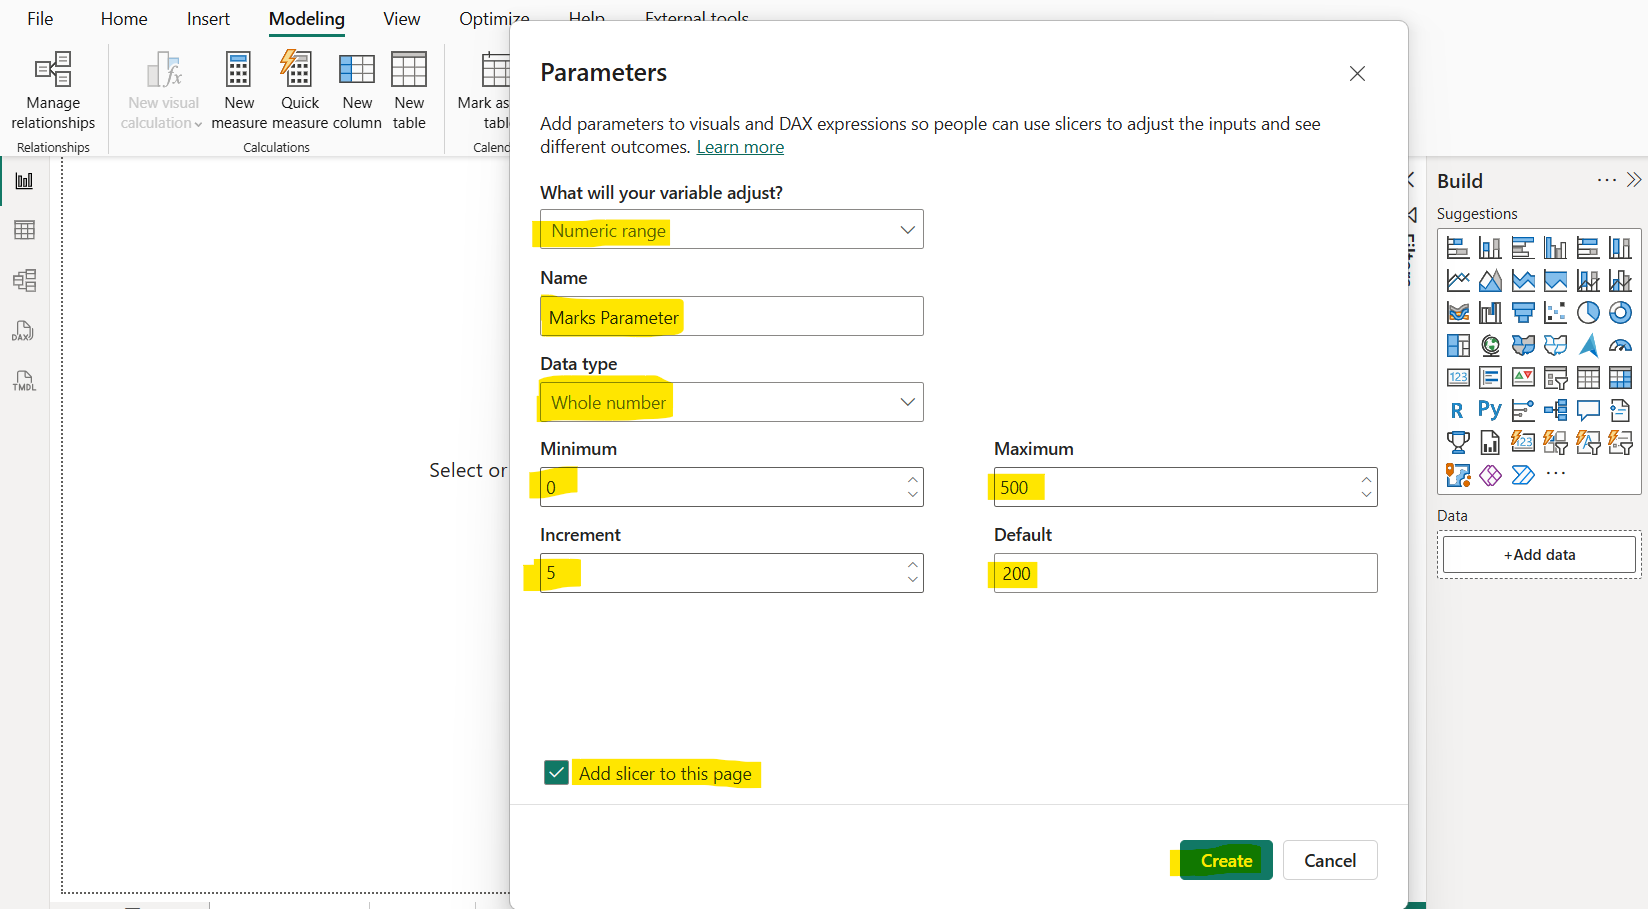
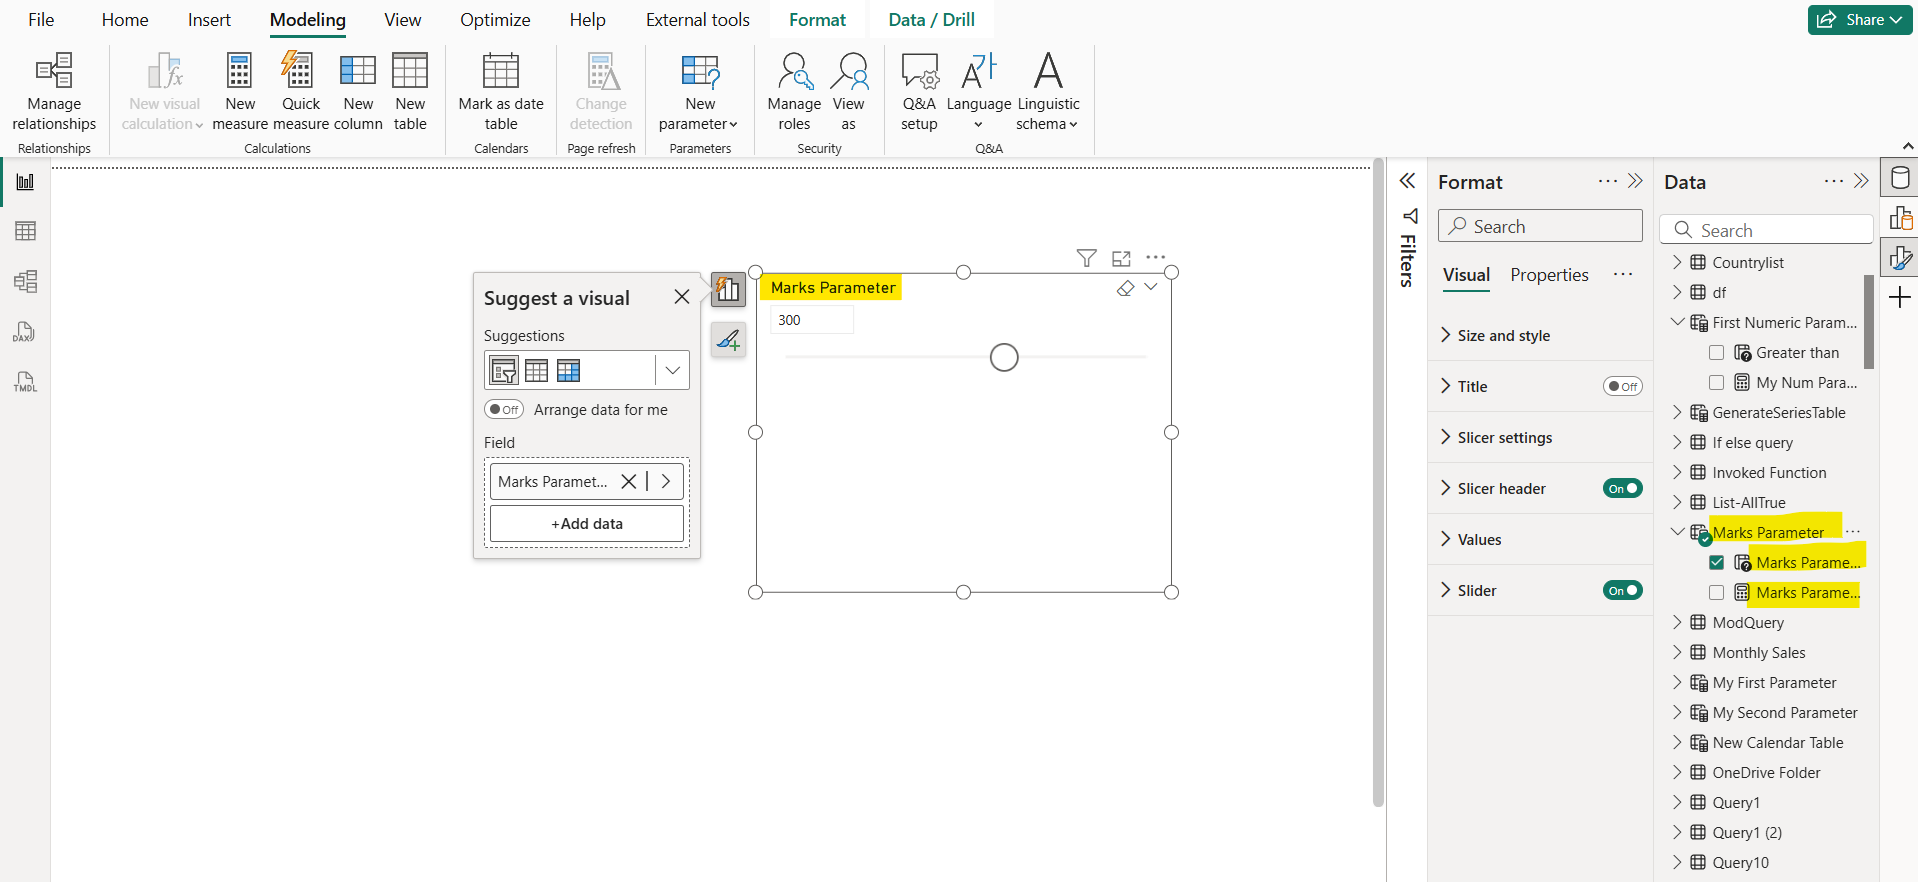
Check the checkbox “Add slicer to this page” checkbox automatically puts a slicer with our parameter on the current report page. We can move the slider to see the numbers increase according to the settings that we applied.
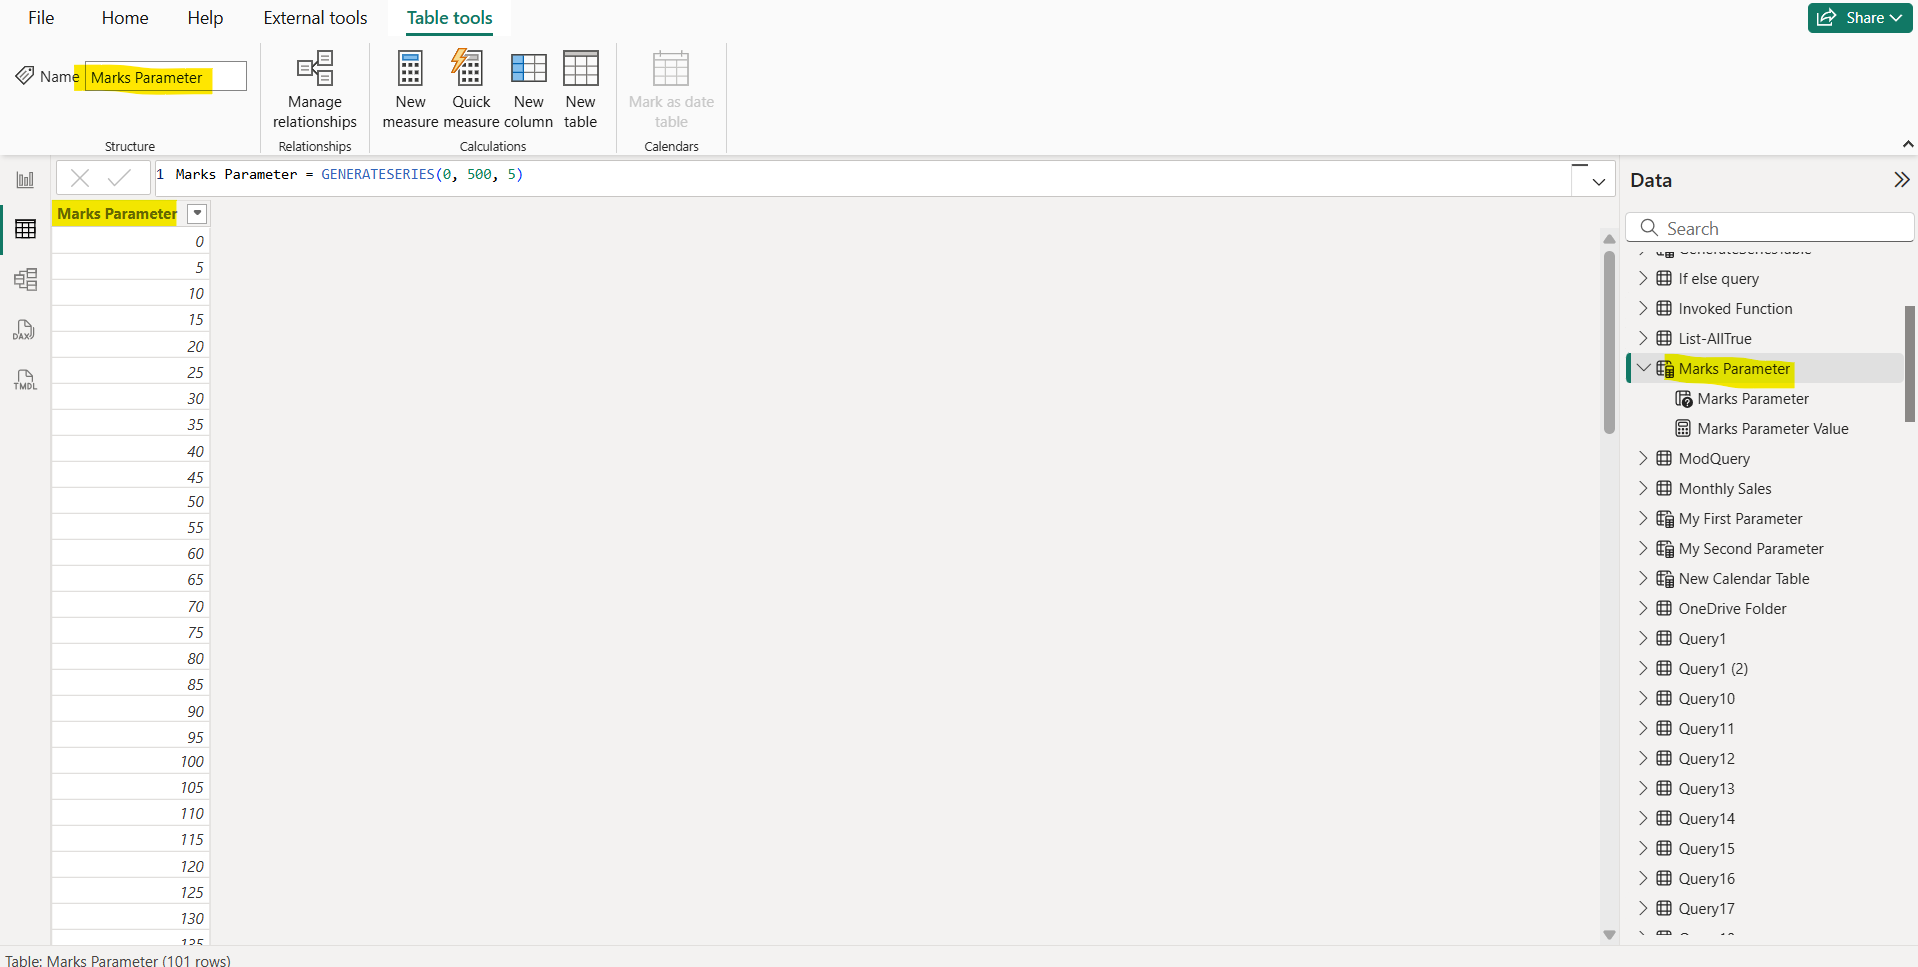
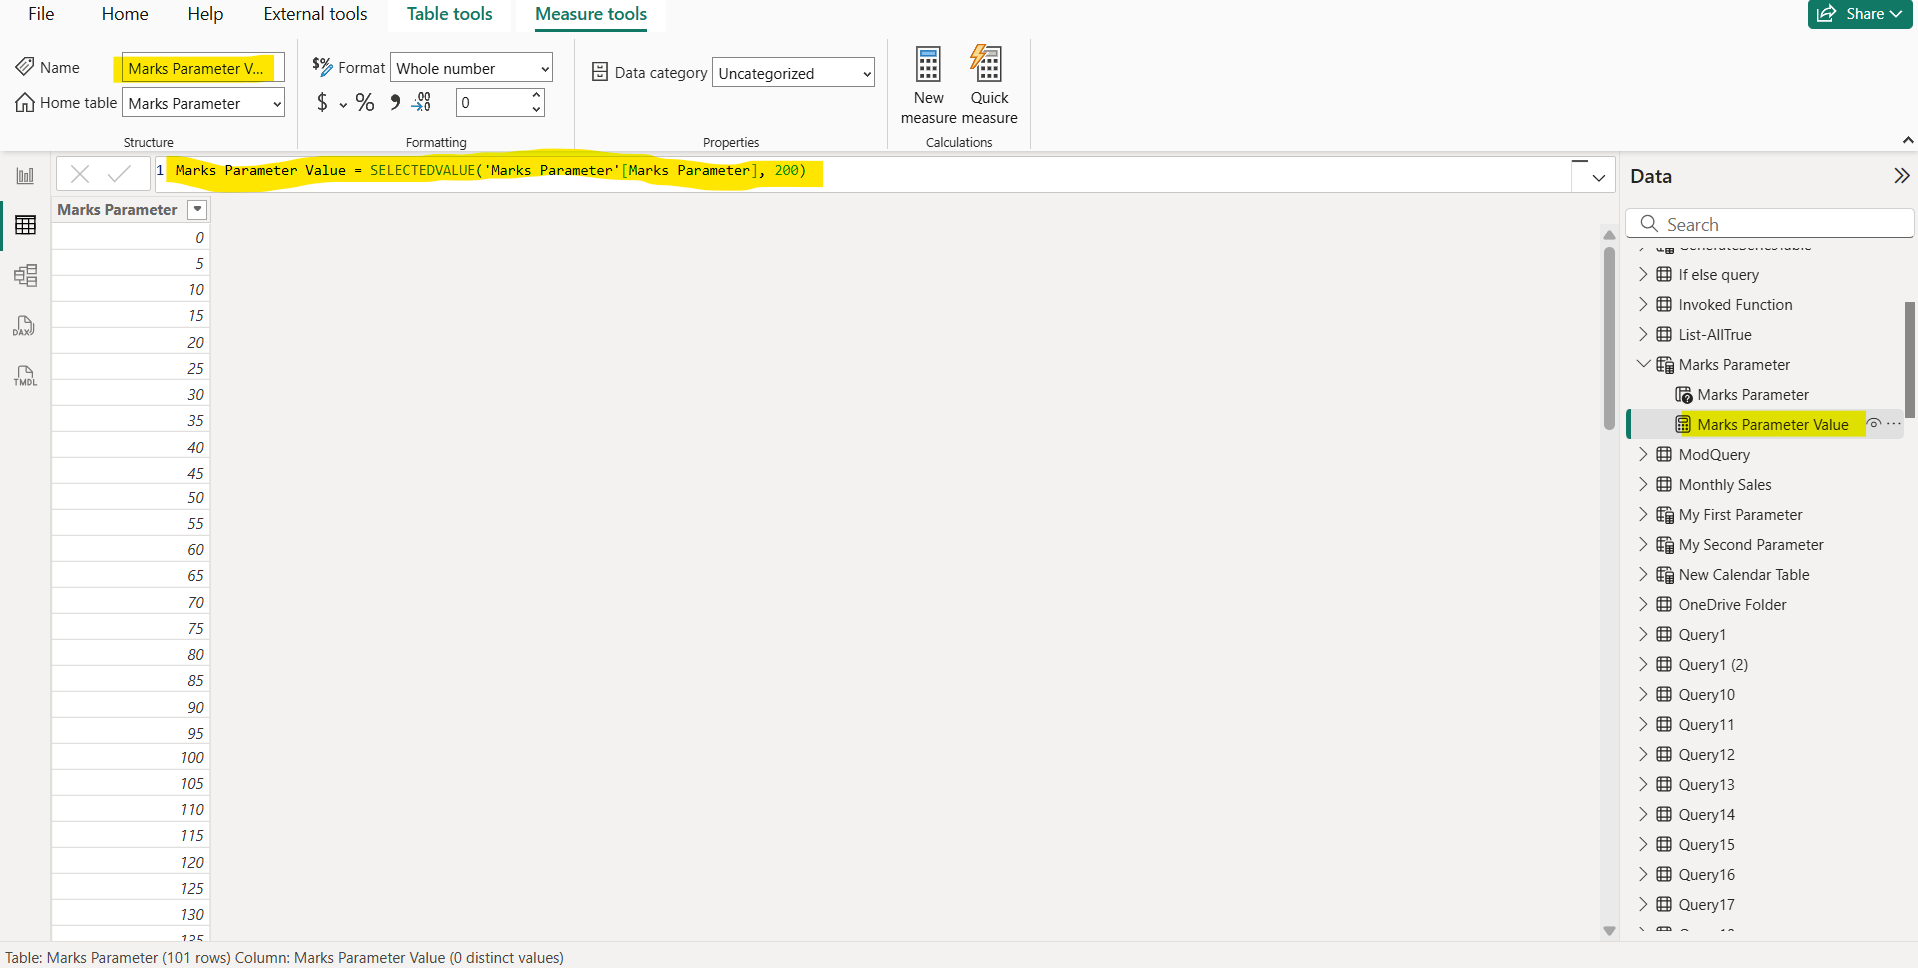
We can go to the Table view, we can see the table of the parameter which is created.
In addition to creating the parameter, the Power BI also creates a measure automatically in this process, which is used to get the current value of the parameter.
DAX
Marks Parameter Value =
SELECTEDVALUE(
    'Marks Parameter'[Marks Parameter],
    200
) 
Note: • The parameter and measure are part of the model, we can delete the slicer from the report page. If we want it back, we can drag the parameter from the Fields list onto the canvas and then change the visual type to a slicer.
• They're available throughout the report and can be used on other report pages.
We can use this measure in the DAX formulas to make the dax code dynamic, as shown below:
DAX
10th Marks Measure =
CALCULATE (
    SUM ( Sheet1[10th Marks] ),
    FILTER ( Sheet1, Sheet1[10th Marks] > 'Marks Parameter'[Marks Parameter Value] )
)
Let’s add the measure on the report page and its Name field from the table.
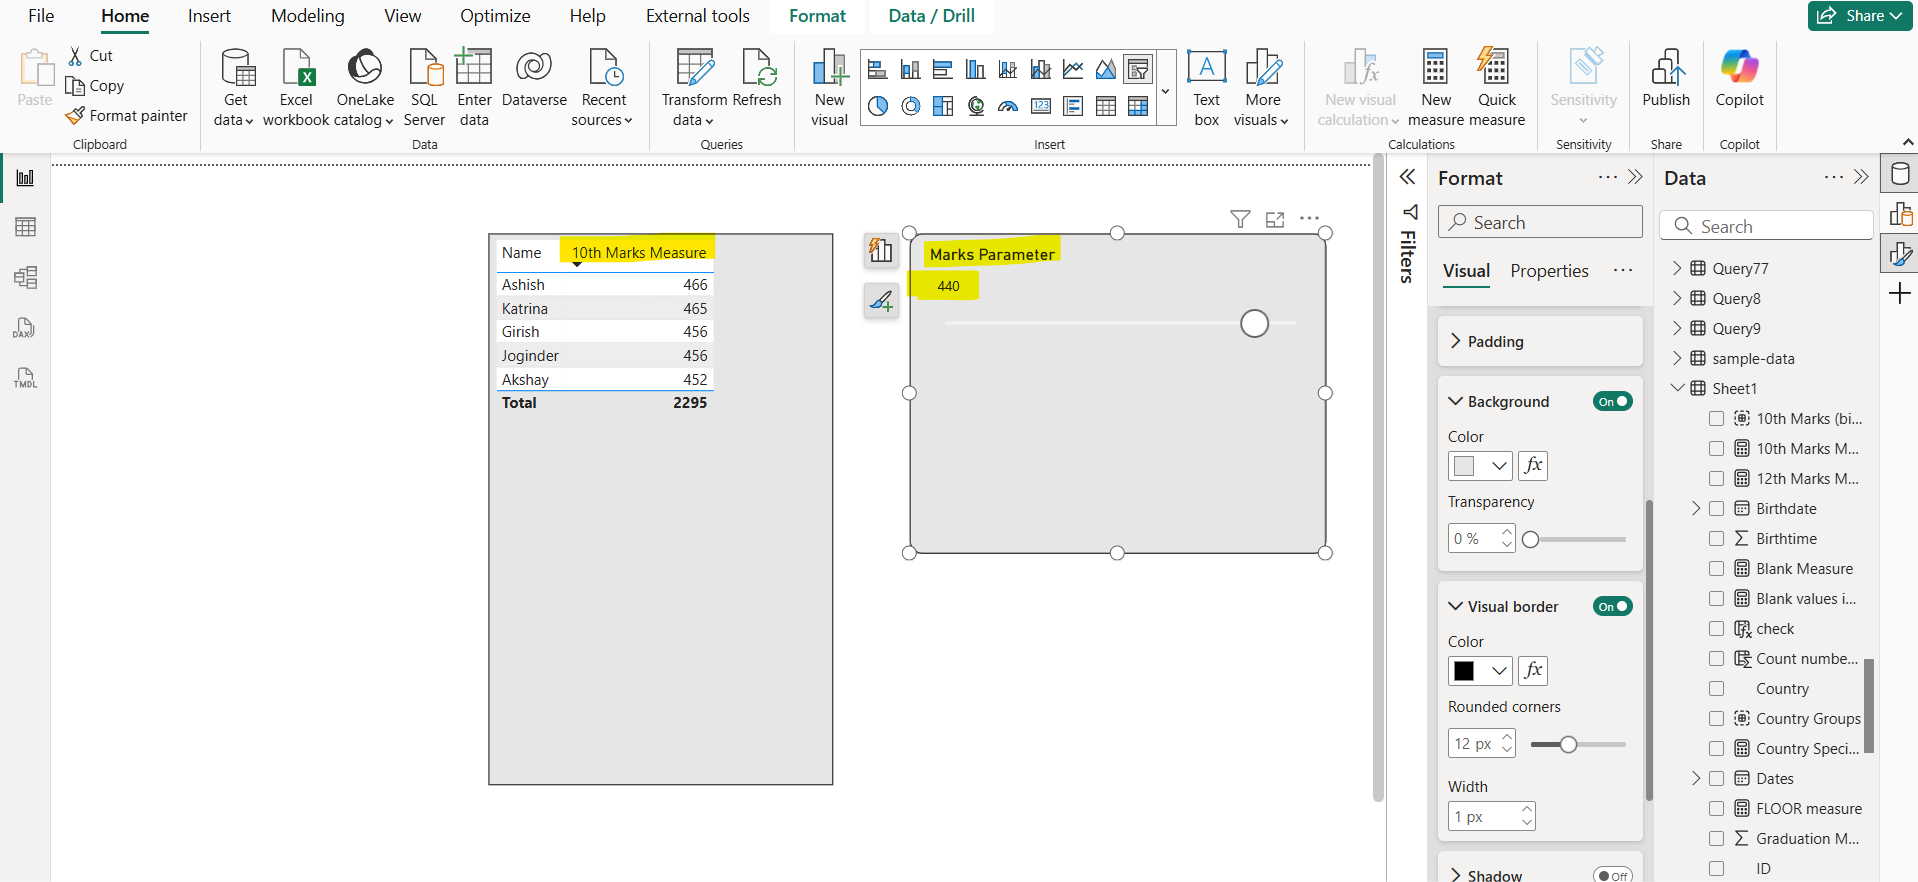
Here, we can see only the marks which are greater than 440. Let’s change the slider value see its effect.
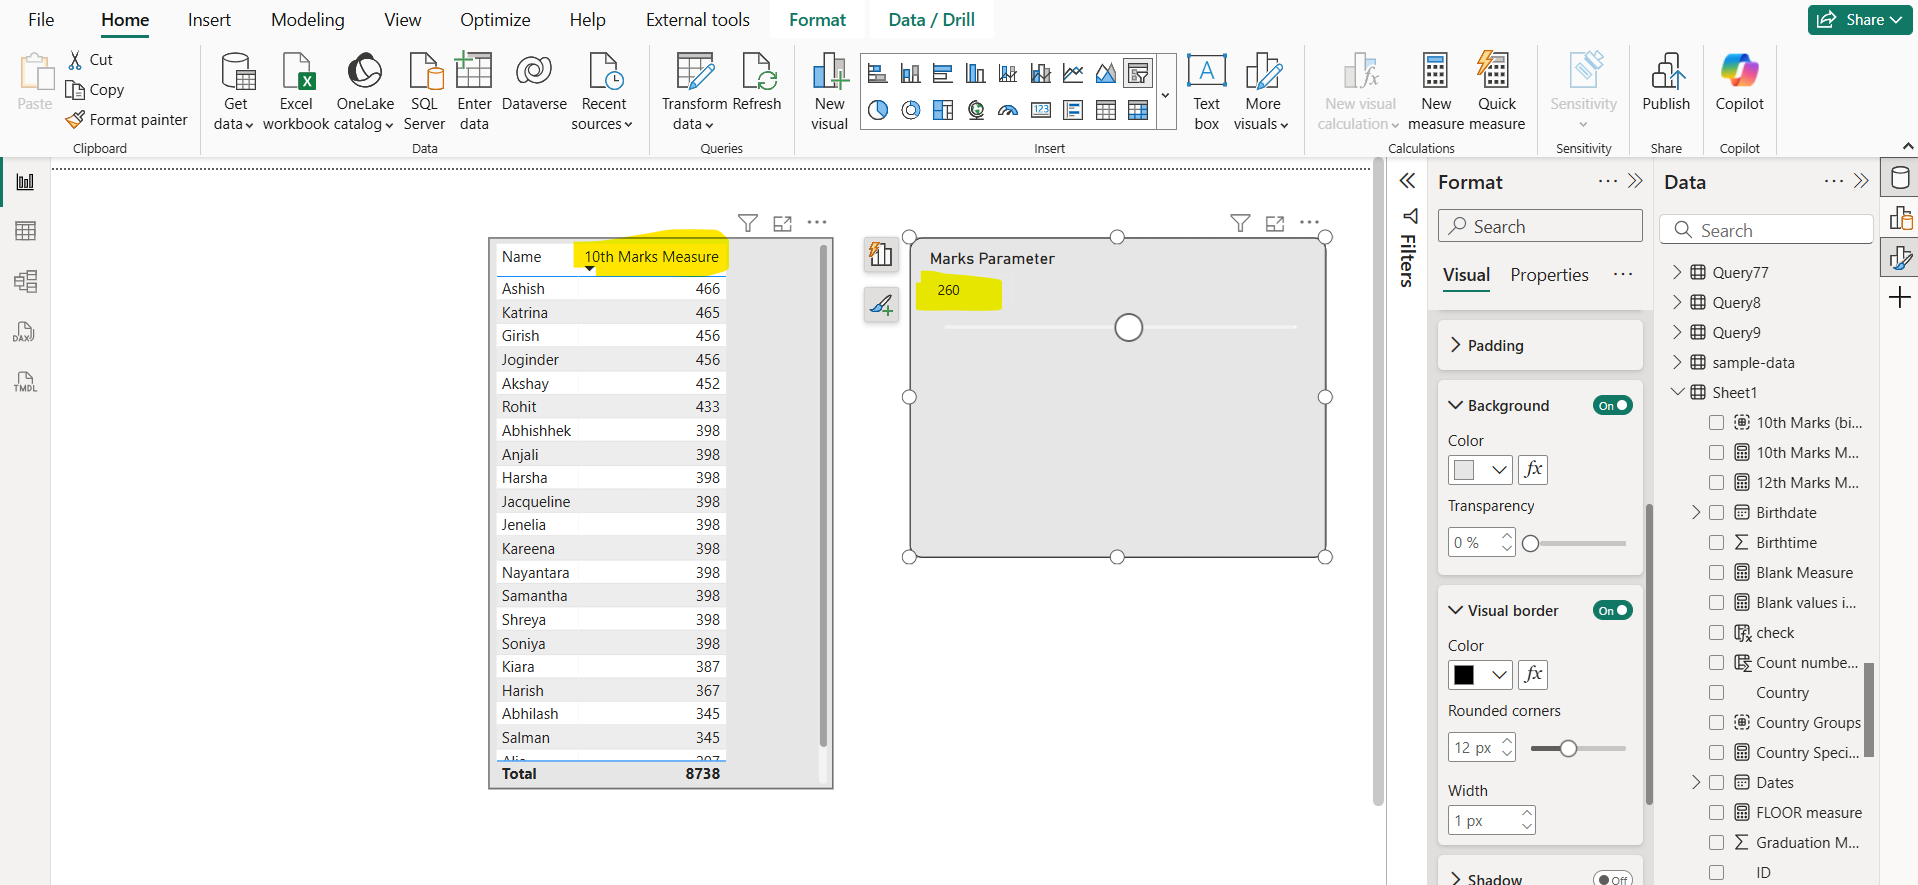
Now it shows the data which are greater than 260.