Decomposition Tree visual in Power BI
The Decomposition Tree visual in Power BI is a powerful, interactive tool designed to help users explore and analyze data across multiple dimensions.
The Decomposition Tree visual displays data hierarchically, starting with a single aggregated metric (e.g., total sales, profit) and allowing users to break it down into contributing factors or dimensions.
Step 1: Select the Decomposition Tree visual icon from the Visualizations pane in the Power BI.
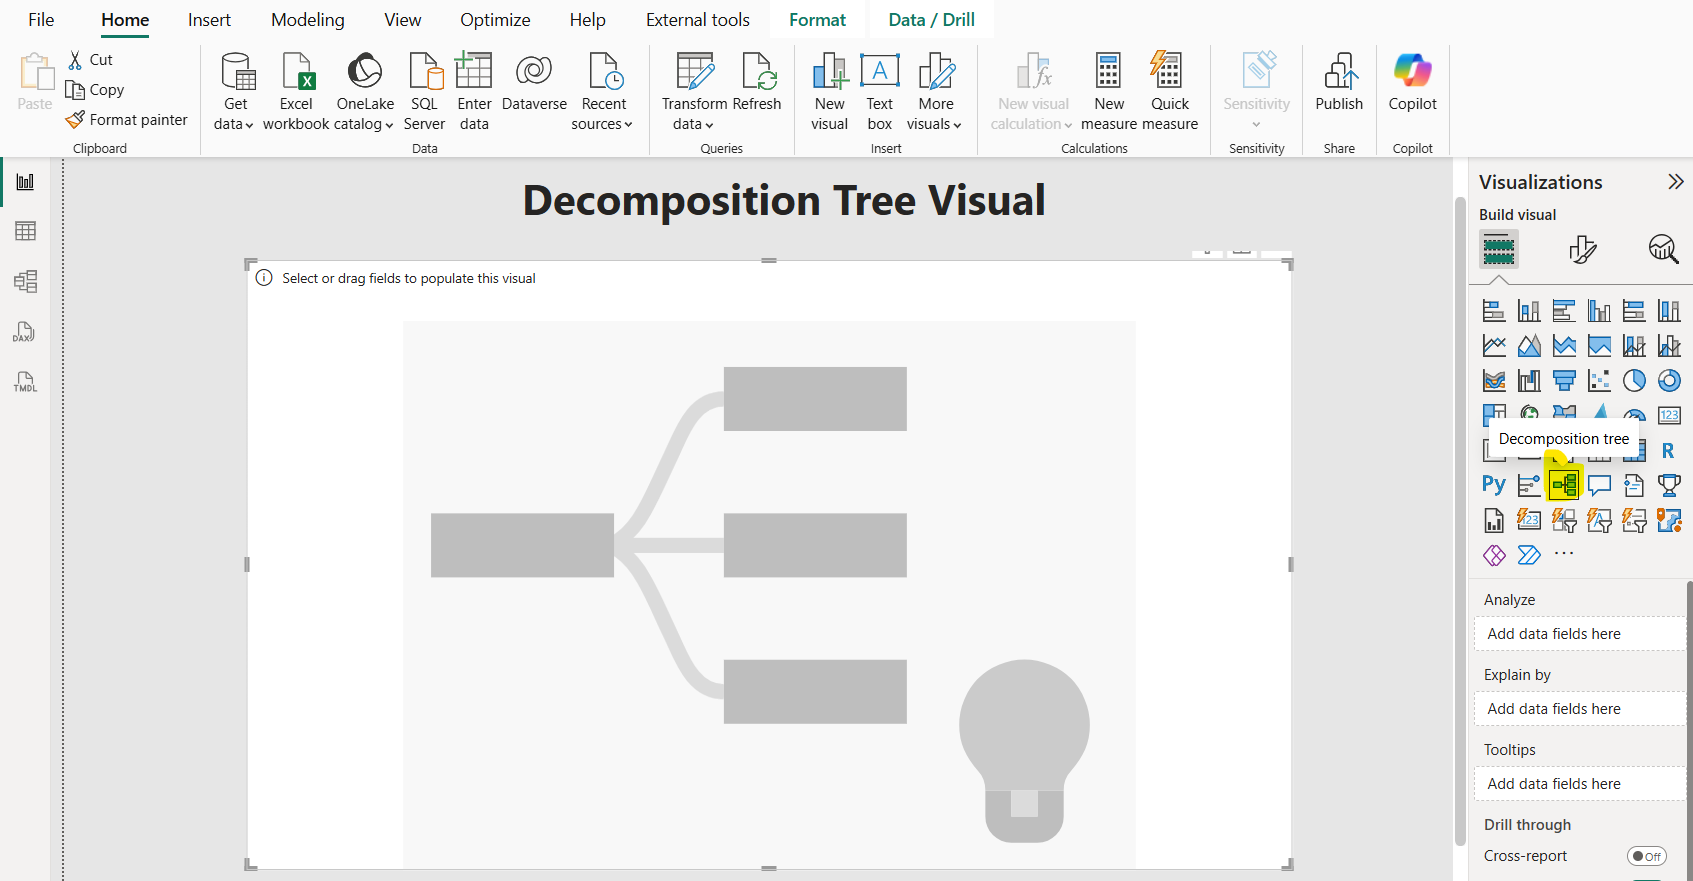
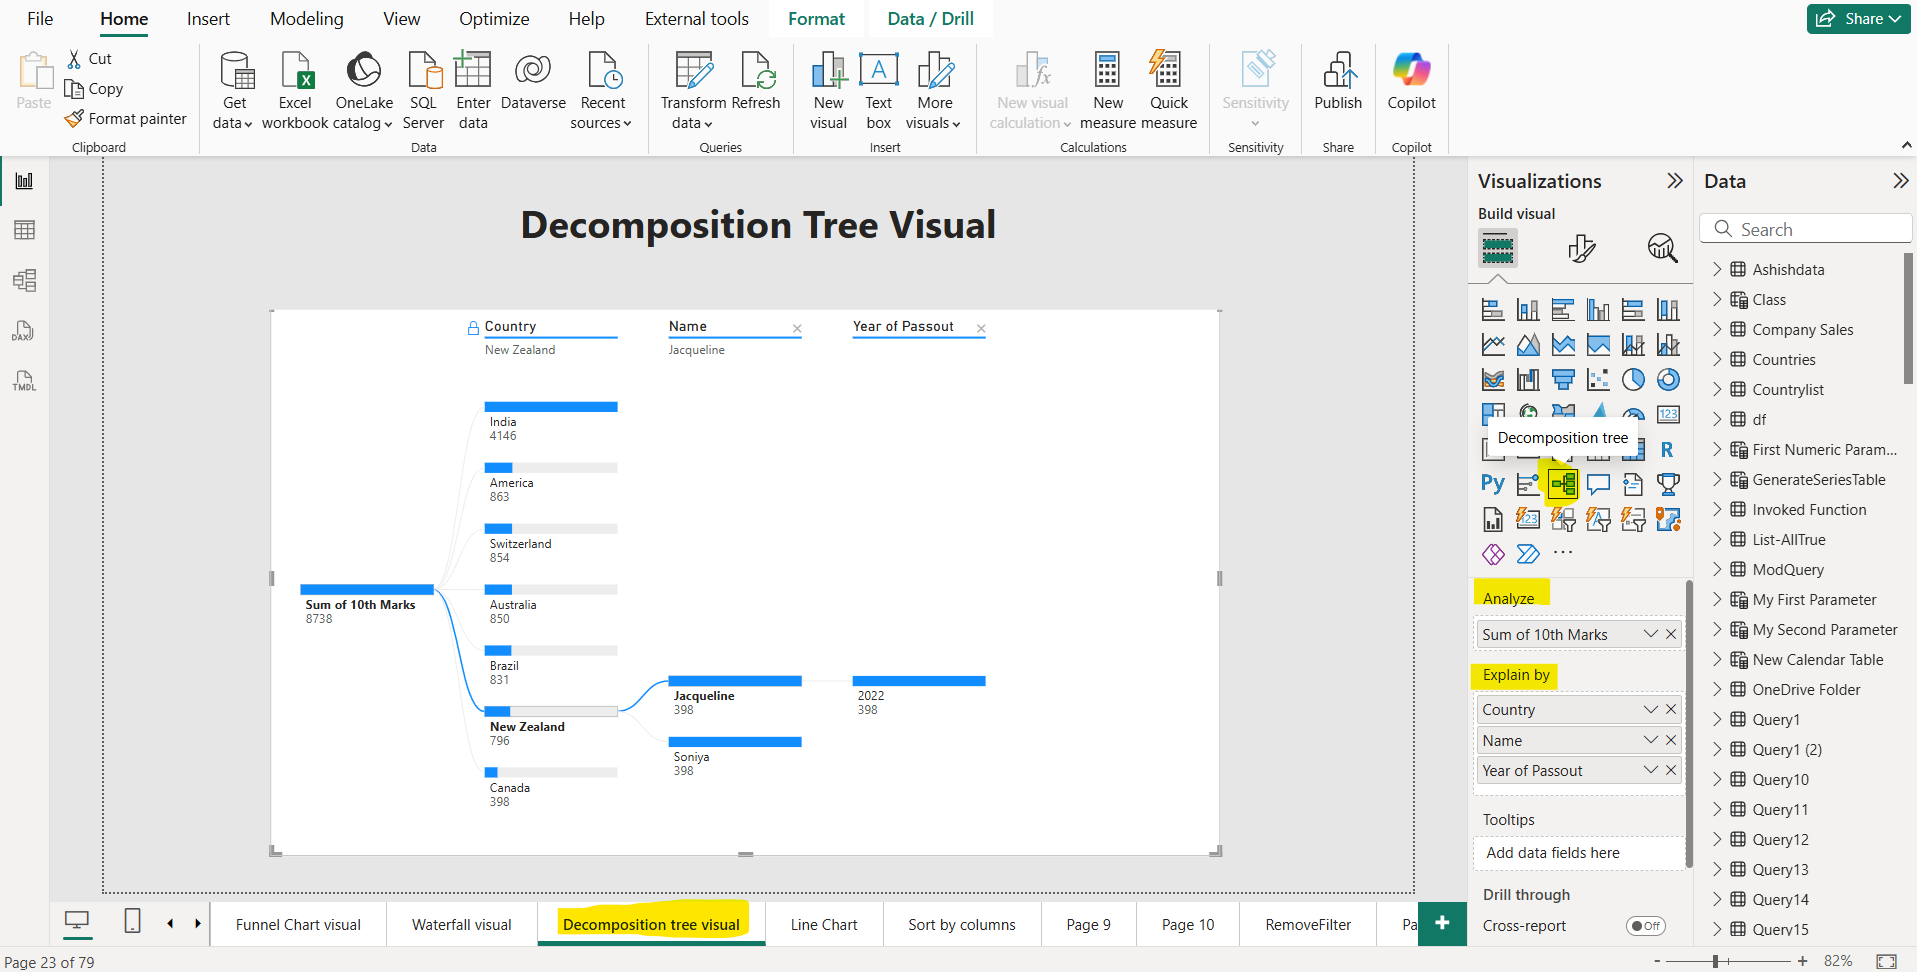
Step 2: Let’s configure the Fields. The visual has two main field wells: Analyze and Explain By.
- Analyze: Drag a numeric measure or aggregate (e.g., Sum of Sales, Average Profit) into this field. This is the starting point or "root node" of the tree, showing the total aggregated value.
- Explain By: Add one or more dimensions (e.g., Category, Region, Year) that we want to use to break down the measure. These are the fields we’ll drill into.
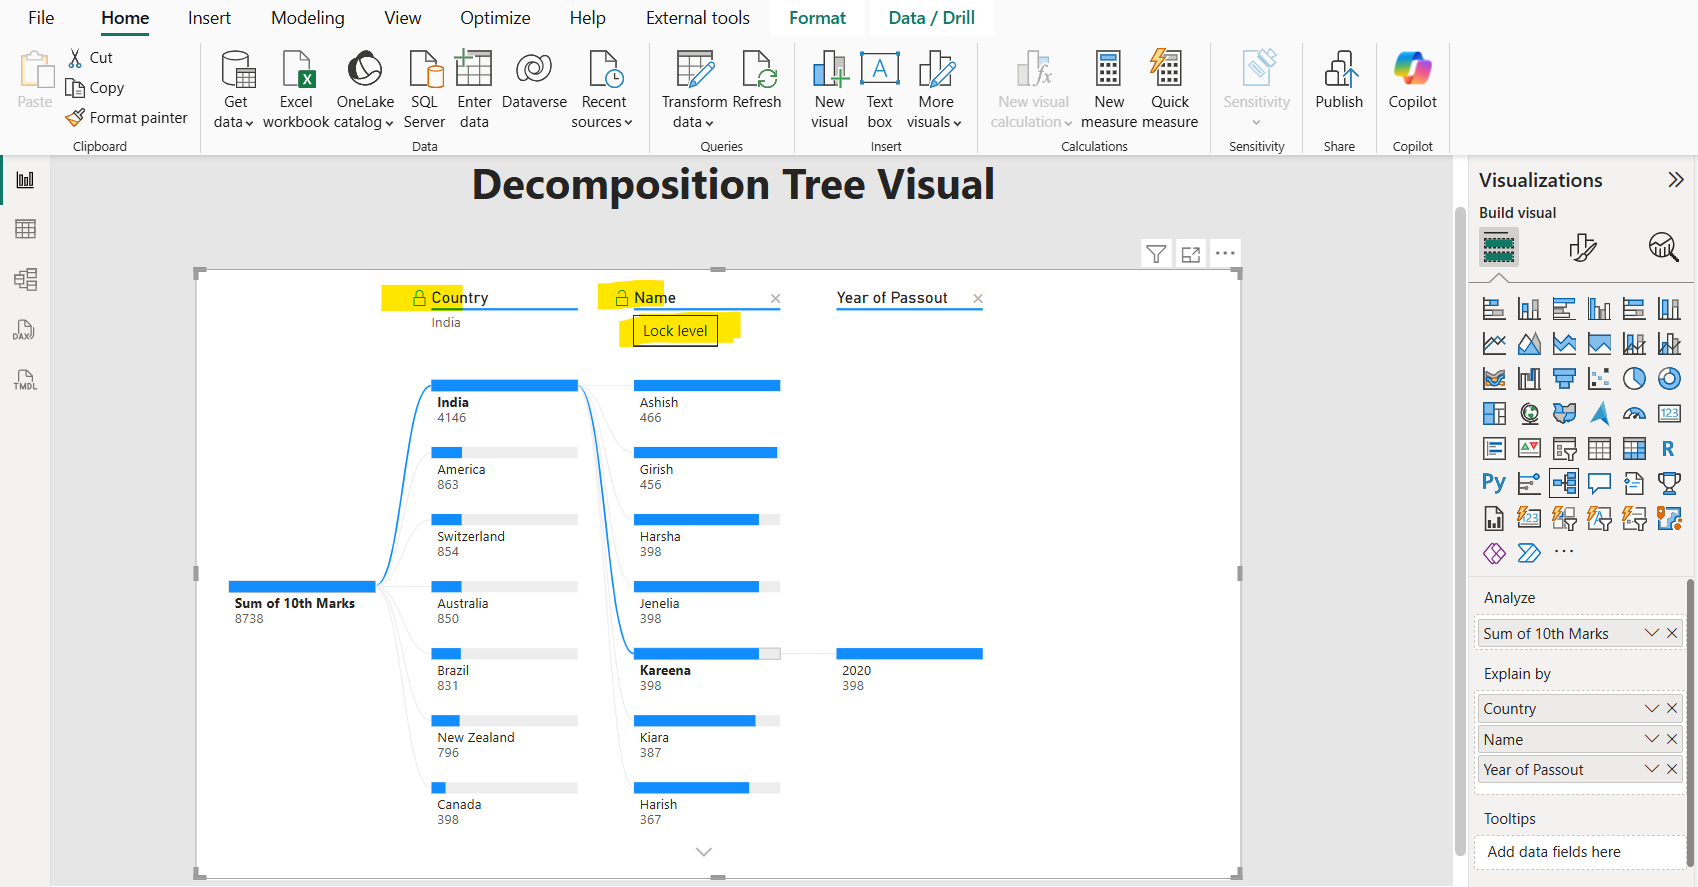
Step 3: Locking Levels Report creators can lock specific levels to guide users’ analysis. For example, if the tree starts with Sales by Region, locking the Region level prevents users from removing or changing it, though they can still explore sub-paths within that level. To lock a level, hover over its header and click the lock icon.
The lock icon next to the Country split means that the report author added the split and set it so that it can't be removed.
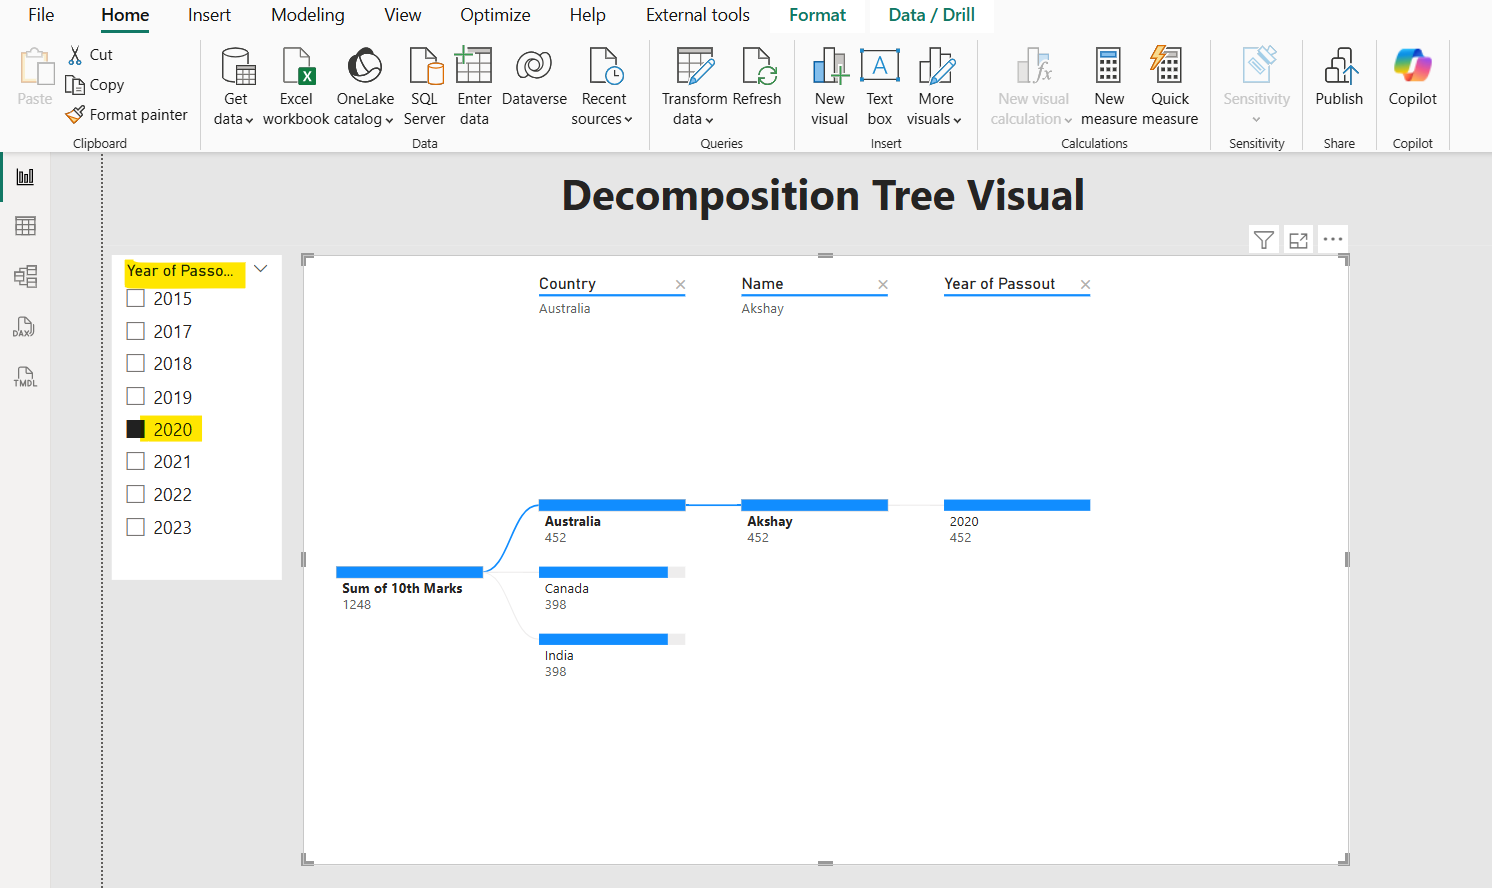
Step 4: Cross-Filtering The Decomposition Tree interacts with other visuals on the report page. For instance, if you filter a bar chart to show data for April, the Decomposition Tree updates dynamically, recalculating its nodes and AI splits based on the filtered data.
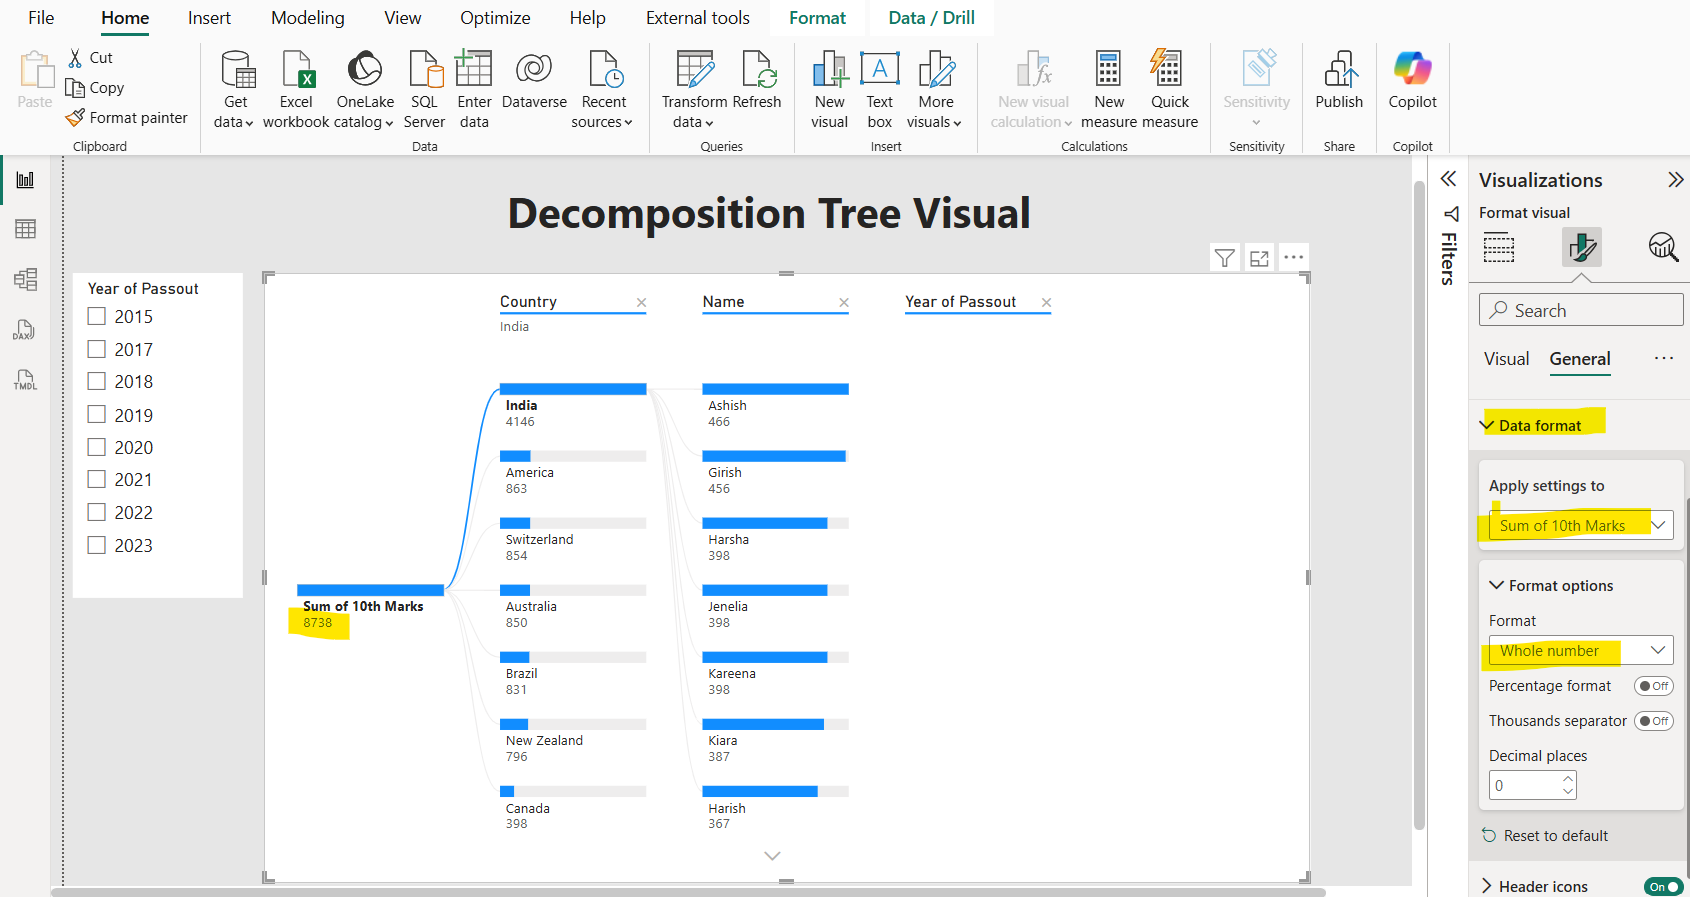
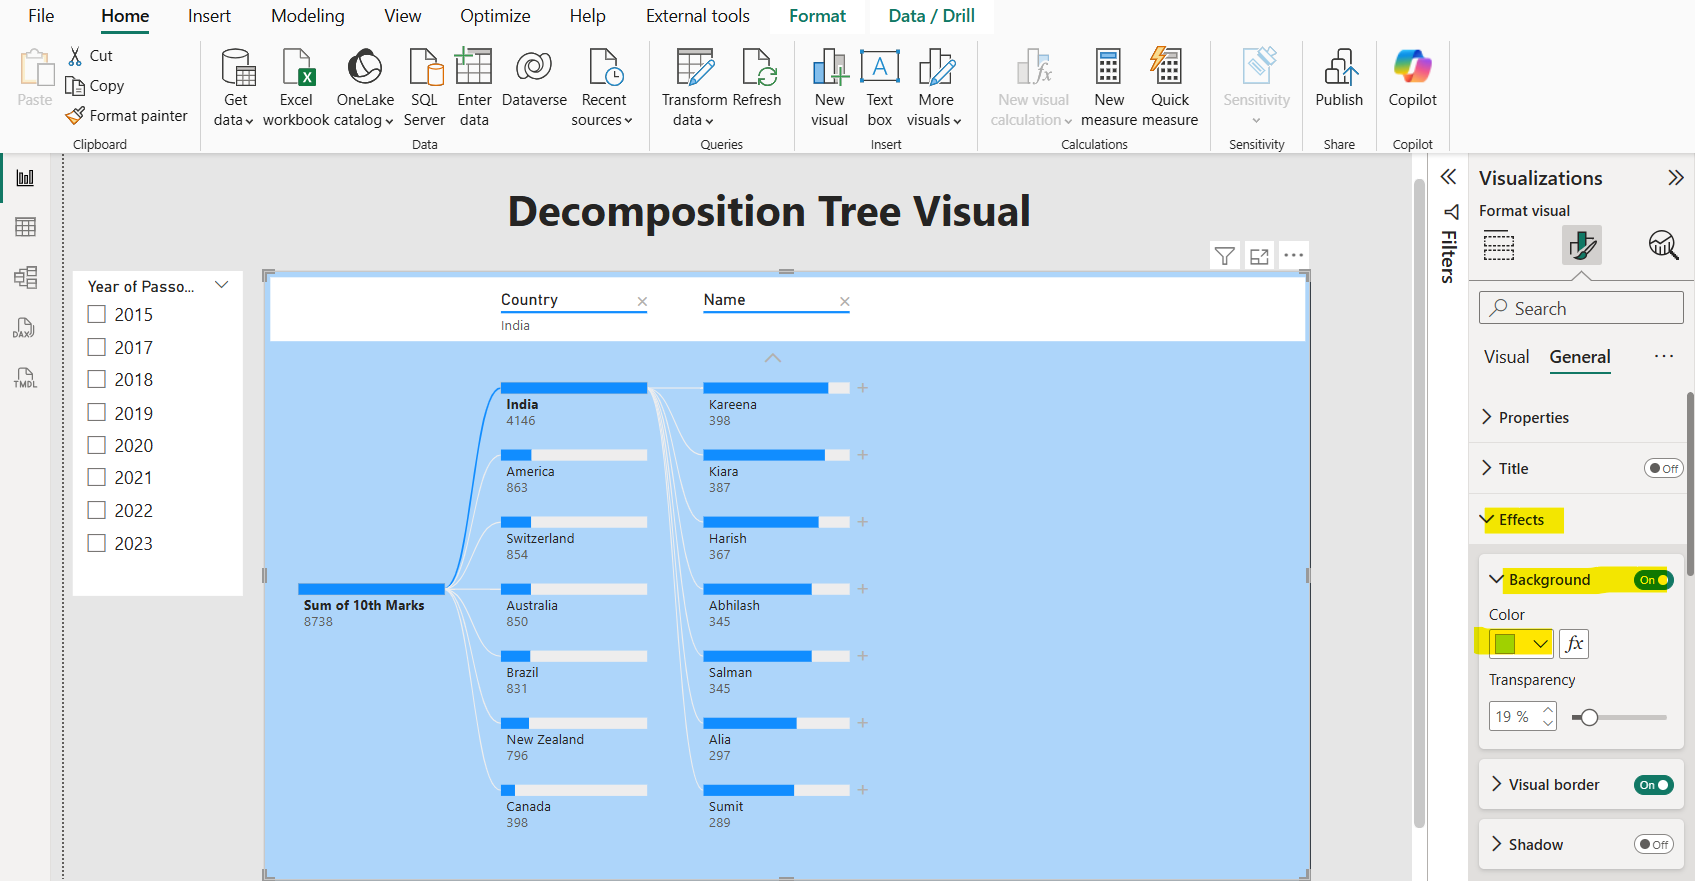
Step 5: Formatting the visual We can format the visual in the Power BI. Formatting options (e.g., colors, fonts, bar styles) are available in the Format Visual pane.
We can specify the Data Format at the visual level, as shown in the image below:
We can specify the Background color of the visual, as shown in the image below:
Step 6: Tooltips We can enhance the visual with tooltips by dragging additional fields into the Tooltips section, providing more context when hovering over nodes.