Slicer - A Filter in Power BI
A slicer is a type of filter that we can add to our report, so users can segment the data in the report by a specific value, such as by year or geographical location. Slicers narrow the portion of the dataset that is shown in the other report visualizations.
Note: We can add as many slicers as we want to a report page.
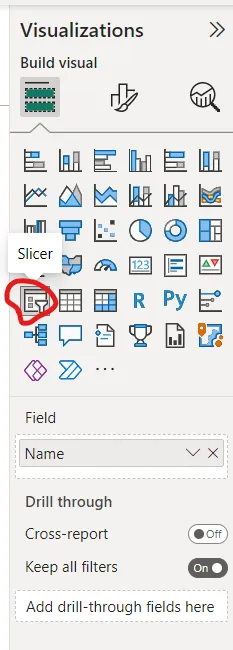
To add a slicer, first de-select the image by clicking an empty area of the report page. In the Visualizations pane, select the Slicer.
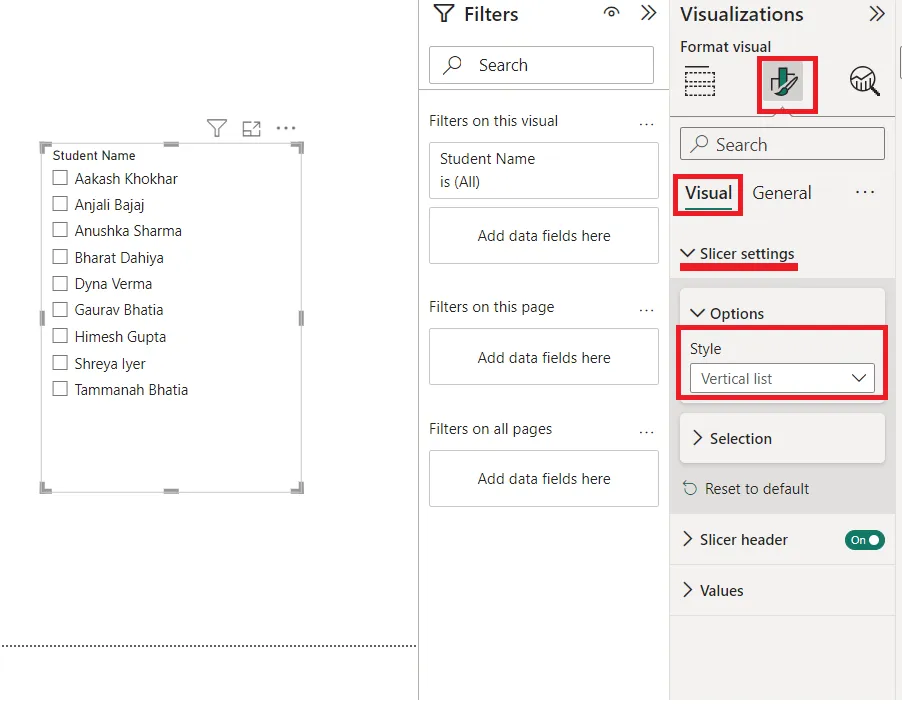
We can change the slicer style from the Vertical list, Tile, or Dropdown by selecting the slicer and then click on Format and then in the Slicer settings section select the Style dropdown to choose the desired style.
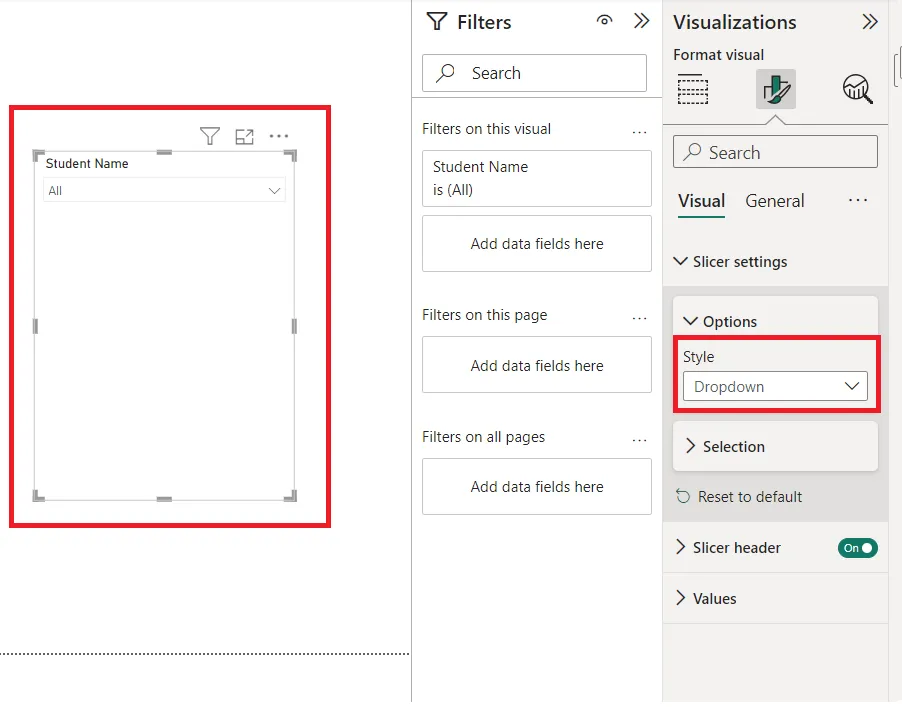
This following is the Dropdown style type slicer.
By clicking on the All option, we get the list of all option.
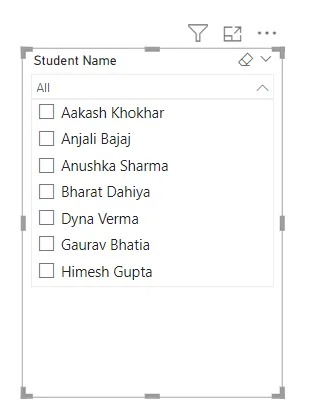
Tip Slicer list items are sorted in ascending order, by default. To reverse the sort order to descending, select the ellipsis (...) in the top right corner of the slicer and choose Sort descending.
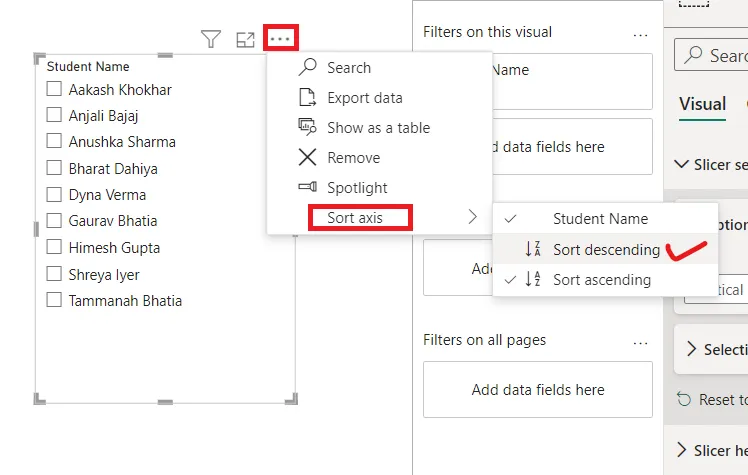
Control which page visuals are affected by slicers
By default, slicers on report pages affect all the other visualizations on that page, including each other.
The filtered data is an intersection of the values selected in both slicers. Select the Slicer from the canvas then go to the Format ribbon from the menu, and then select Edit interactions.

Filter controls, each with a Filter and a None option, appear above all the visuals on the page. Initially, the Filter option is preselected on all the controls.
Select the None option in the filter control on the visuals to stop the Slicer from filtering it.
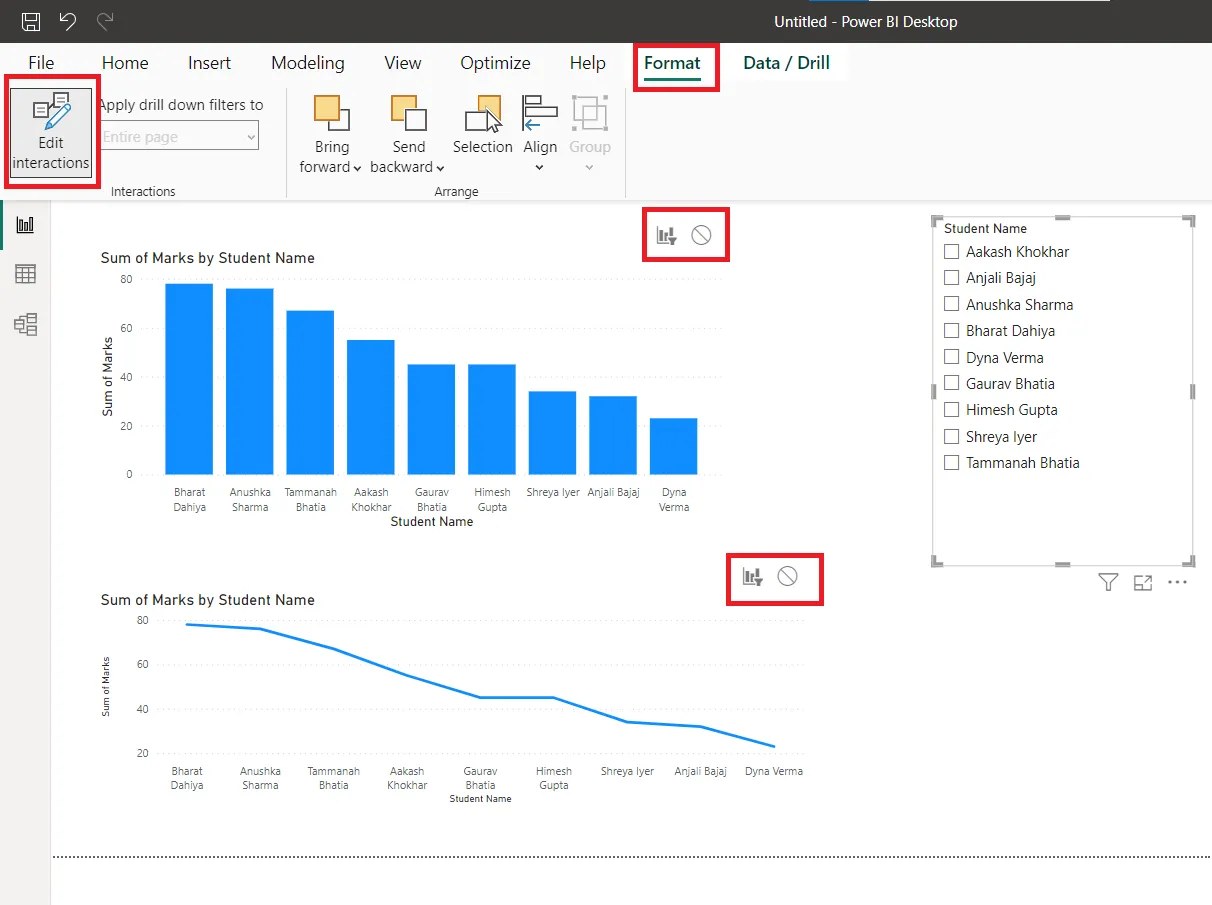
When multiple visuals exist on the same report page, they all interact with each other. For that reason, we should become familiar with these interactions to see how our report changes.
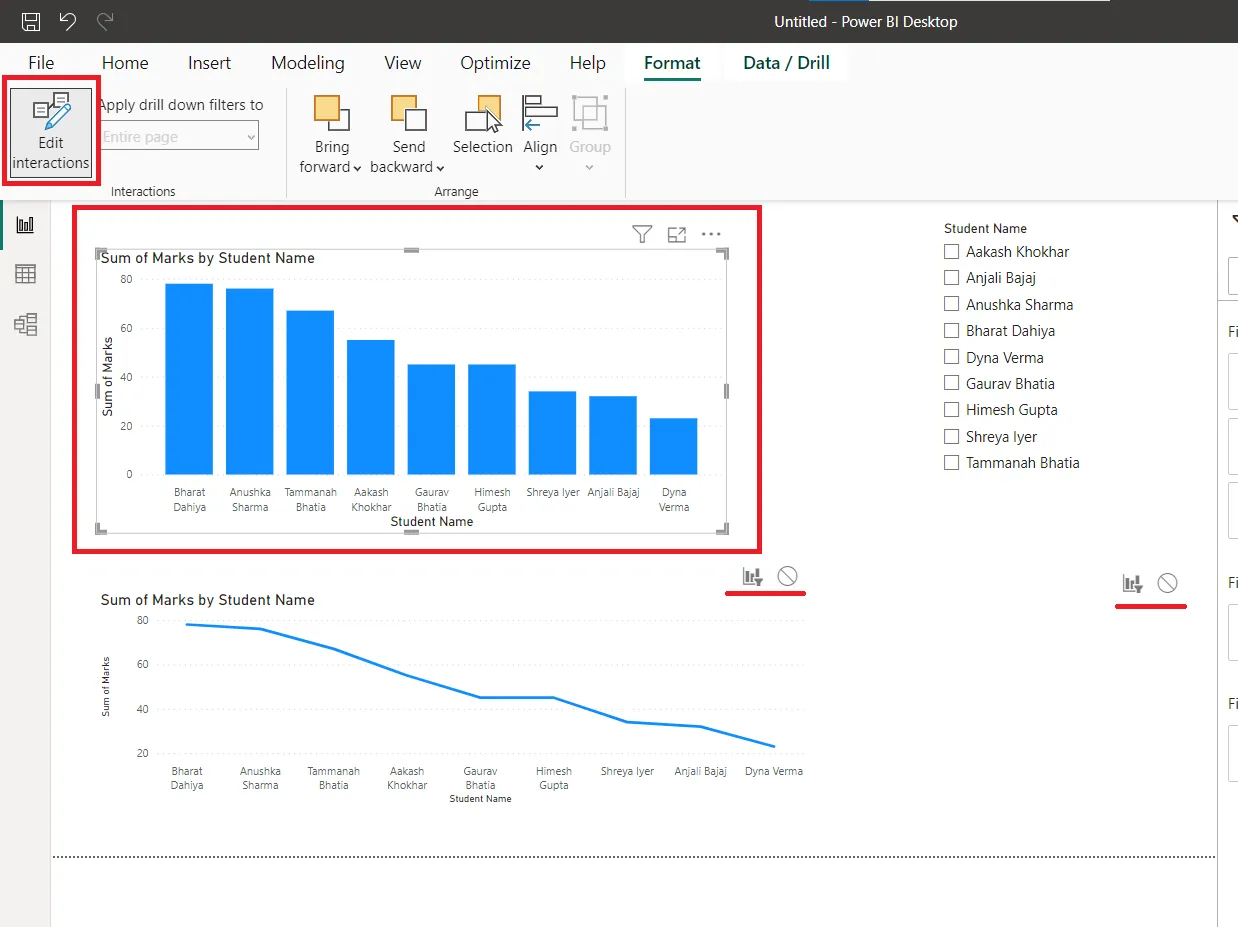
If we select other visual (other than slicer), and then click on Edit interactions and we can see the same options of Filter and None.
When we select an element in a visual, such as a student name in the Sum of Marks by Student Name visual, the other visuals update to reflect our selection, as illustrated in the following image.
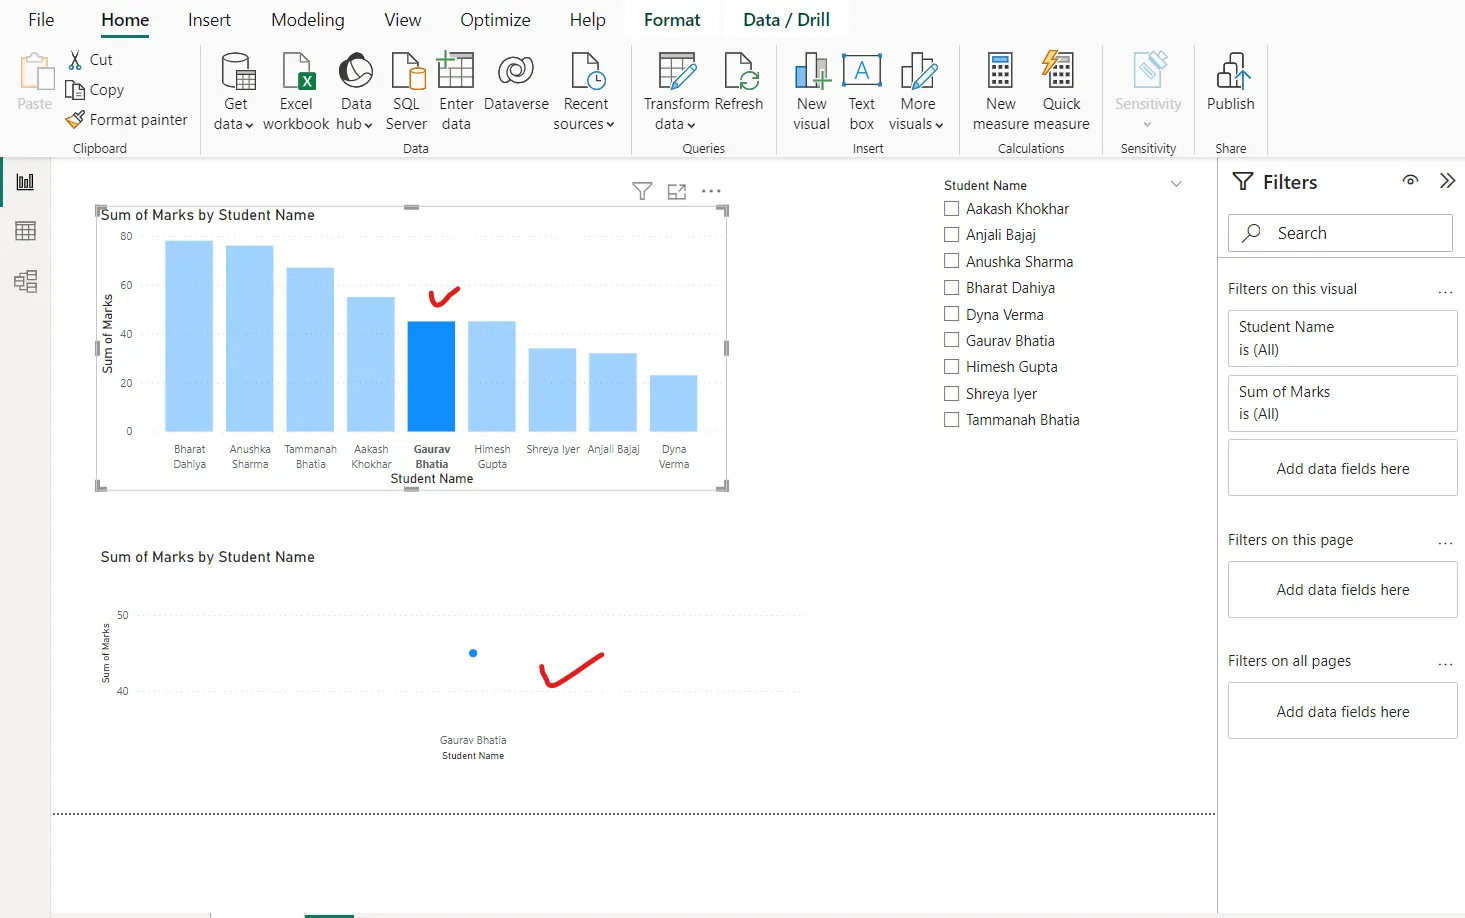
When we have become familiar with the interactions, we might want to make changes to control how those interactions flow between the visuals.
a) Selection controls options
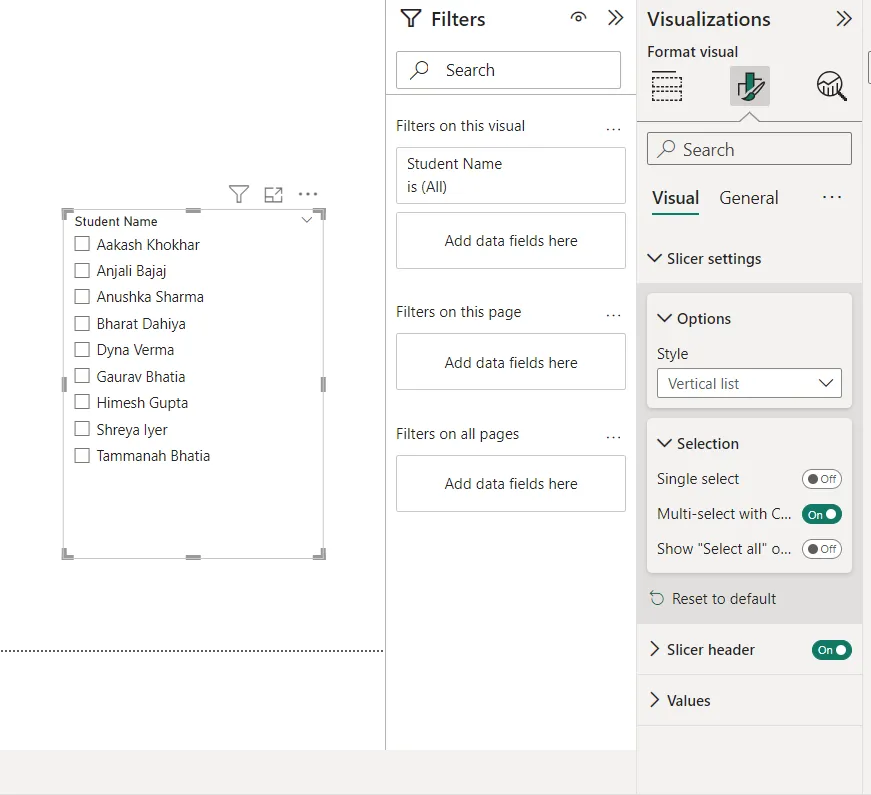
Select the slicer and then, in the Format pane, expand the Selection section in Slicer settings section to view the following options:
• Single select - This option is Off by default. It ensures that only one item can be selected at a time.
• Multi-select with CTRL - This option is On by default. It allows us to select multiple items by pressing the Ctrl key.
• Show "Select all" - This option is Off by default. If we turn on this option, a Select all check box is added to the slicer. We might want to add this option so that we can quickly select or clear all items in the list. If we select all items, selecting an item will clear it, allowing an is-not type of filter.
b) Sync and use slicers on other pages
We can sync a slicer and use it on any or all pages in a report. In Power BI Desktop, select a slicer on the report page and then click on the View ribbon, and then select Sync slicers.
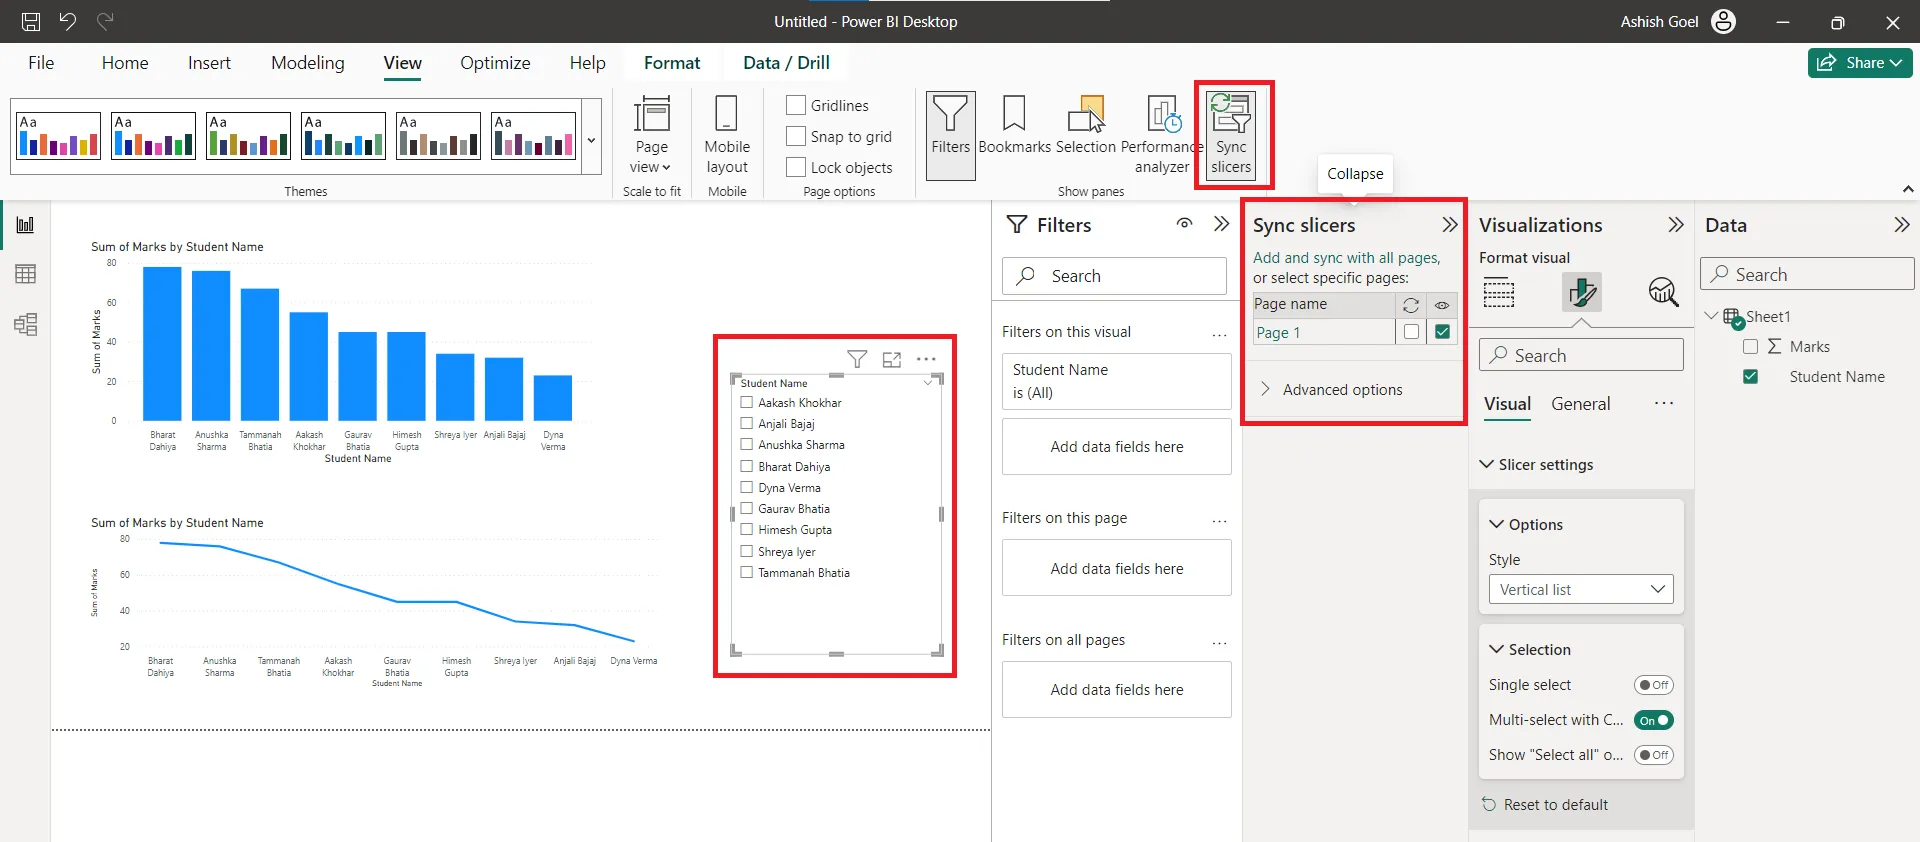
The Sync slicers pane appears between the Filters and Visualizations panes.
In the Visible column of the Sync slicers pane, the slicer is made visible or not by selecting the checkbox. In the other column which looks like a refresh icon, when selected, the slicers are synced on the selected pages.
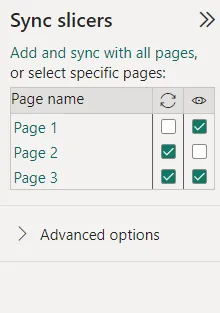
For example, the above diagram configures the slicer visible on Page 1, and Page 3 and synced on Page 2 and Page 3, means any change in that slicer on page 2 or page 3 the resultant effect of that slicer is visible on the visuals on the other page.